spmR canonical examples
spm_example.RmdThis vignette is intentionally limited to two canonical example directories that are provided with the package for reading archived output:
-
examples/atkaforrunSPM(),dat2list(), andplotSPMx() -
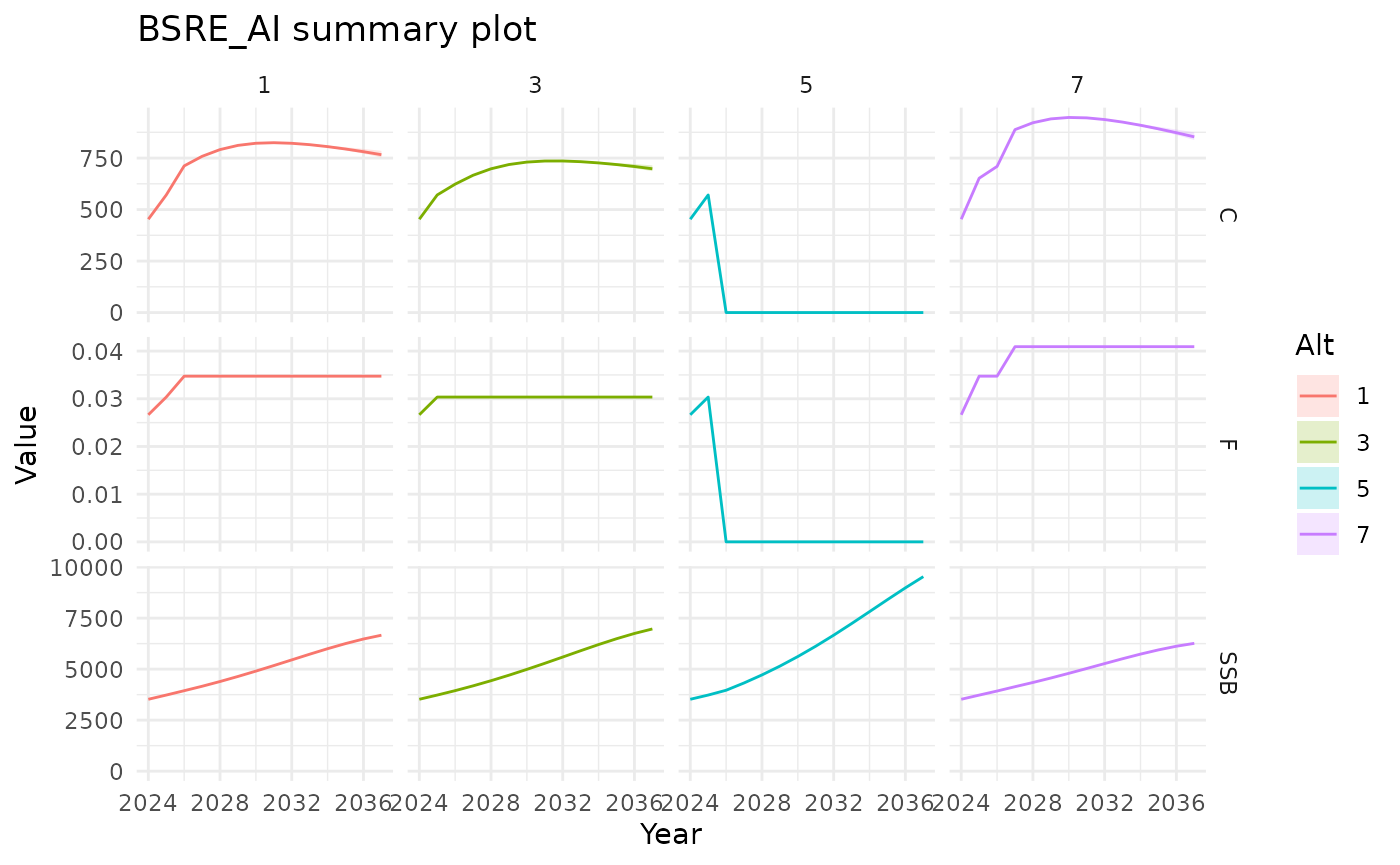
examples/BSRE_AIforplotSPM()withspm_summary.csv
The bundled positional files retain their historical layout. For a new run, create metadata with explicit recruitment basis and female/male population weights, then use a format-2 executable. Follow the runnable split-sex input migration guide. Keep each species file’s existing field order and store added population vectors in the metadata.
1. Atka workflow (examples/atka)
Use runSPM() to read existing ADMB output
(spm_detail.csv) and inspect inputs using
dat2list().
pkg_root <- if (file.exists("DESCRIPTION")) "." else ".."
atka_dir <- file.path(pkg_root, "examples", "atka")

atka_detail <- runSPM(atka_dir, run = FALSE, engine = "admb")
str(atka_detail)
#> spm_rslt [105,000 × 20] (S3: spm_result/spec_tbl_df/tbl_df/tbl/data.frame)
#>  $ Stock      : chr [1:105000] "Model_16.0b" "Model_16.0b" "Model_16.0b" "Model_16.0b" ...
#>  $ Alt        : num [1:105000] 1 1 1 1 1 1 1 1 1 1 ...
#>  $ Sim        : num [1:105000] 1 1 1 1 1 1 1 1 1 1 ...
#>  $ Year       : num [1:105000] 2022 2023 2024 2025 2026 ...
#>  $ SSB        : num [1:105000] 137805 122551 111309 106528 107685 ...
#>  $ Rec        : num [1:105000] 648 518 358 529 1080 ...
#>  $ Tot_biom   : num [1:105000] 631455 619958 620871 620648 586312 ...
#>  $ SPR_Implied: num [1:105000] 0.517 0.444 0.455 0.413 0.41 ...
#>  $ F          : num [1:105000] 0.372 0.504 0.482 0.576 0.583 ...
#>  $ Ntot       : num [1:105000] 551 514 473 473 483 ...
#>  $ Catch      : num [1:105000] 66481 83800 73495 83297 82317 ...
#>  $ ABC        : num [1:105000] 102578 98592 86706 83297 82317 ...
#>  $ OFL        : num [1:105000] 123759 118791 101474 97783 96860 ...
#>  $ AvgAge     : num [1:105000] 4.73 4.52 4.22 4.06 4.19 ...
#>  $ AvgAgeTot  : num [1:105000] 2.81 2.79 2.97 2.81 2.28 ...
#>  $ SexRatio   : num [1:105000] 0.5 0.5 0.5 0.5 0.5 0.5 0.5 0.5 0.5 0.5 ...
#>  $ B100       : num [1:105000] 280456 280456 280456 280456 280456 ...
#>  $ B40        : num [1:105000] 112182 112182 112182 112182 112182 ...
#>  $ B35        : num [1:105000] 98160 98160 98160 98160 98160 ...
#>  $ Scenario   : chr [1:105000] "1" "1" "1" "1" ...
#>  - attr(*, "spec")=
#>   .. cols(
#>   ..   Stock = col_character(),
#>   ..   Alt = col_double(),
#>   ..   Sim = col_double(),
#>   ..   Year = col_double(),
#>   ..   SSB = col_double(),
#>   ..   Rec = col_double(),
#>   ..   Tot_biom = col_double(),
#>   ..   SPR_Implied = col_double(),
#>   ..   F = col_double(),
#>   ..   Ntot = col_double(),
#>   ..   Catch = col_double(),
#>   ..   ABC = col_double(),
#>   ..   OFL = col_double(),
#>   ..   AvgAge = col_double(),
#>   ..   AvgAgeTot = col_double(),
#>   ..   SexRatio = col_double(),
#>   ..   B100 = col_double(),
#>   ..   B40 = col_double(),
#>   ..   B35 = col_double()
#>   .. )
#>  - attr(*, "problems")=<pointer: 0x5617b250da10>

atka_inputs <- dat2list(file.path(atka_dir, "spm.dat"))
names(atka_inputs)
#>  [1] "rn"               "Tier"             "nalts"            "alts"
#>  [5] "tac_flag"         "srr_type"         "srr_form"         "srr_conditioning"
#>  [9] "srr_reserved"     "spm_detail_flag"  "nprj_yrs"         "nsims"
#> [13] "beg_yr"           "nyrs_fixed_catch" "nspp"             "OY_min"
#> [17] "OY_max"           "datafile"         "ABC_mults"        "scalars"
#> [21] "alt4_spr"         "nTAC_cat"         "nTACind"          "fixed_catch"
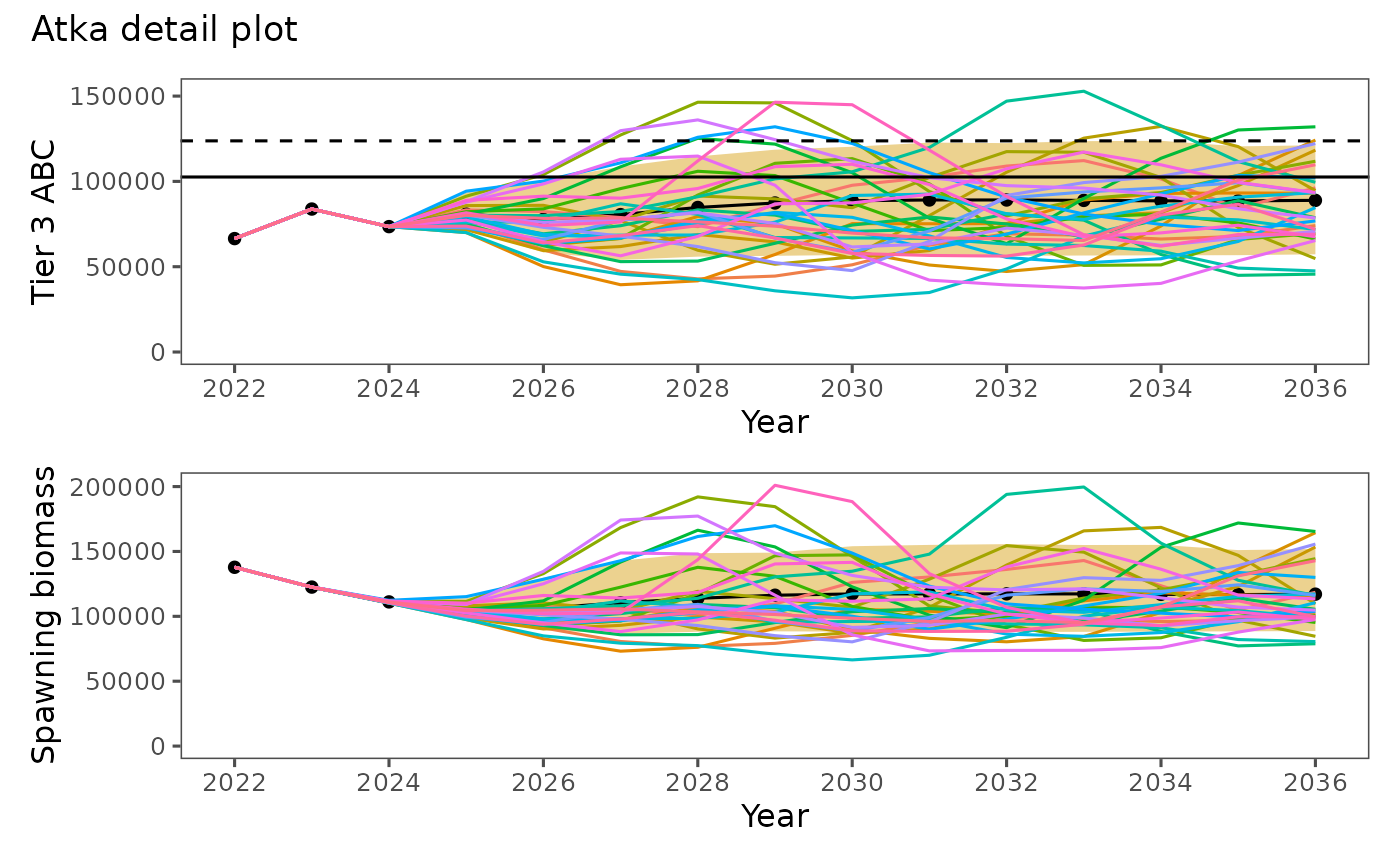
Plot detailed simulation trajectories with
plotSPMx().
Archived experimental RTMB output can also be read from this
directory. New RTMB projections are blocked because the prototype lacks
population dynamics. New ADMB projections require
write_spm_metadata() and a format-2 executable.
runSPM(atka_dir, run = FALSE, engine = "rtmb")