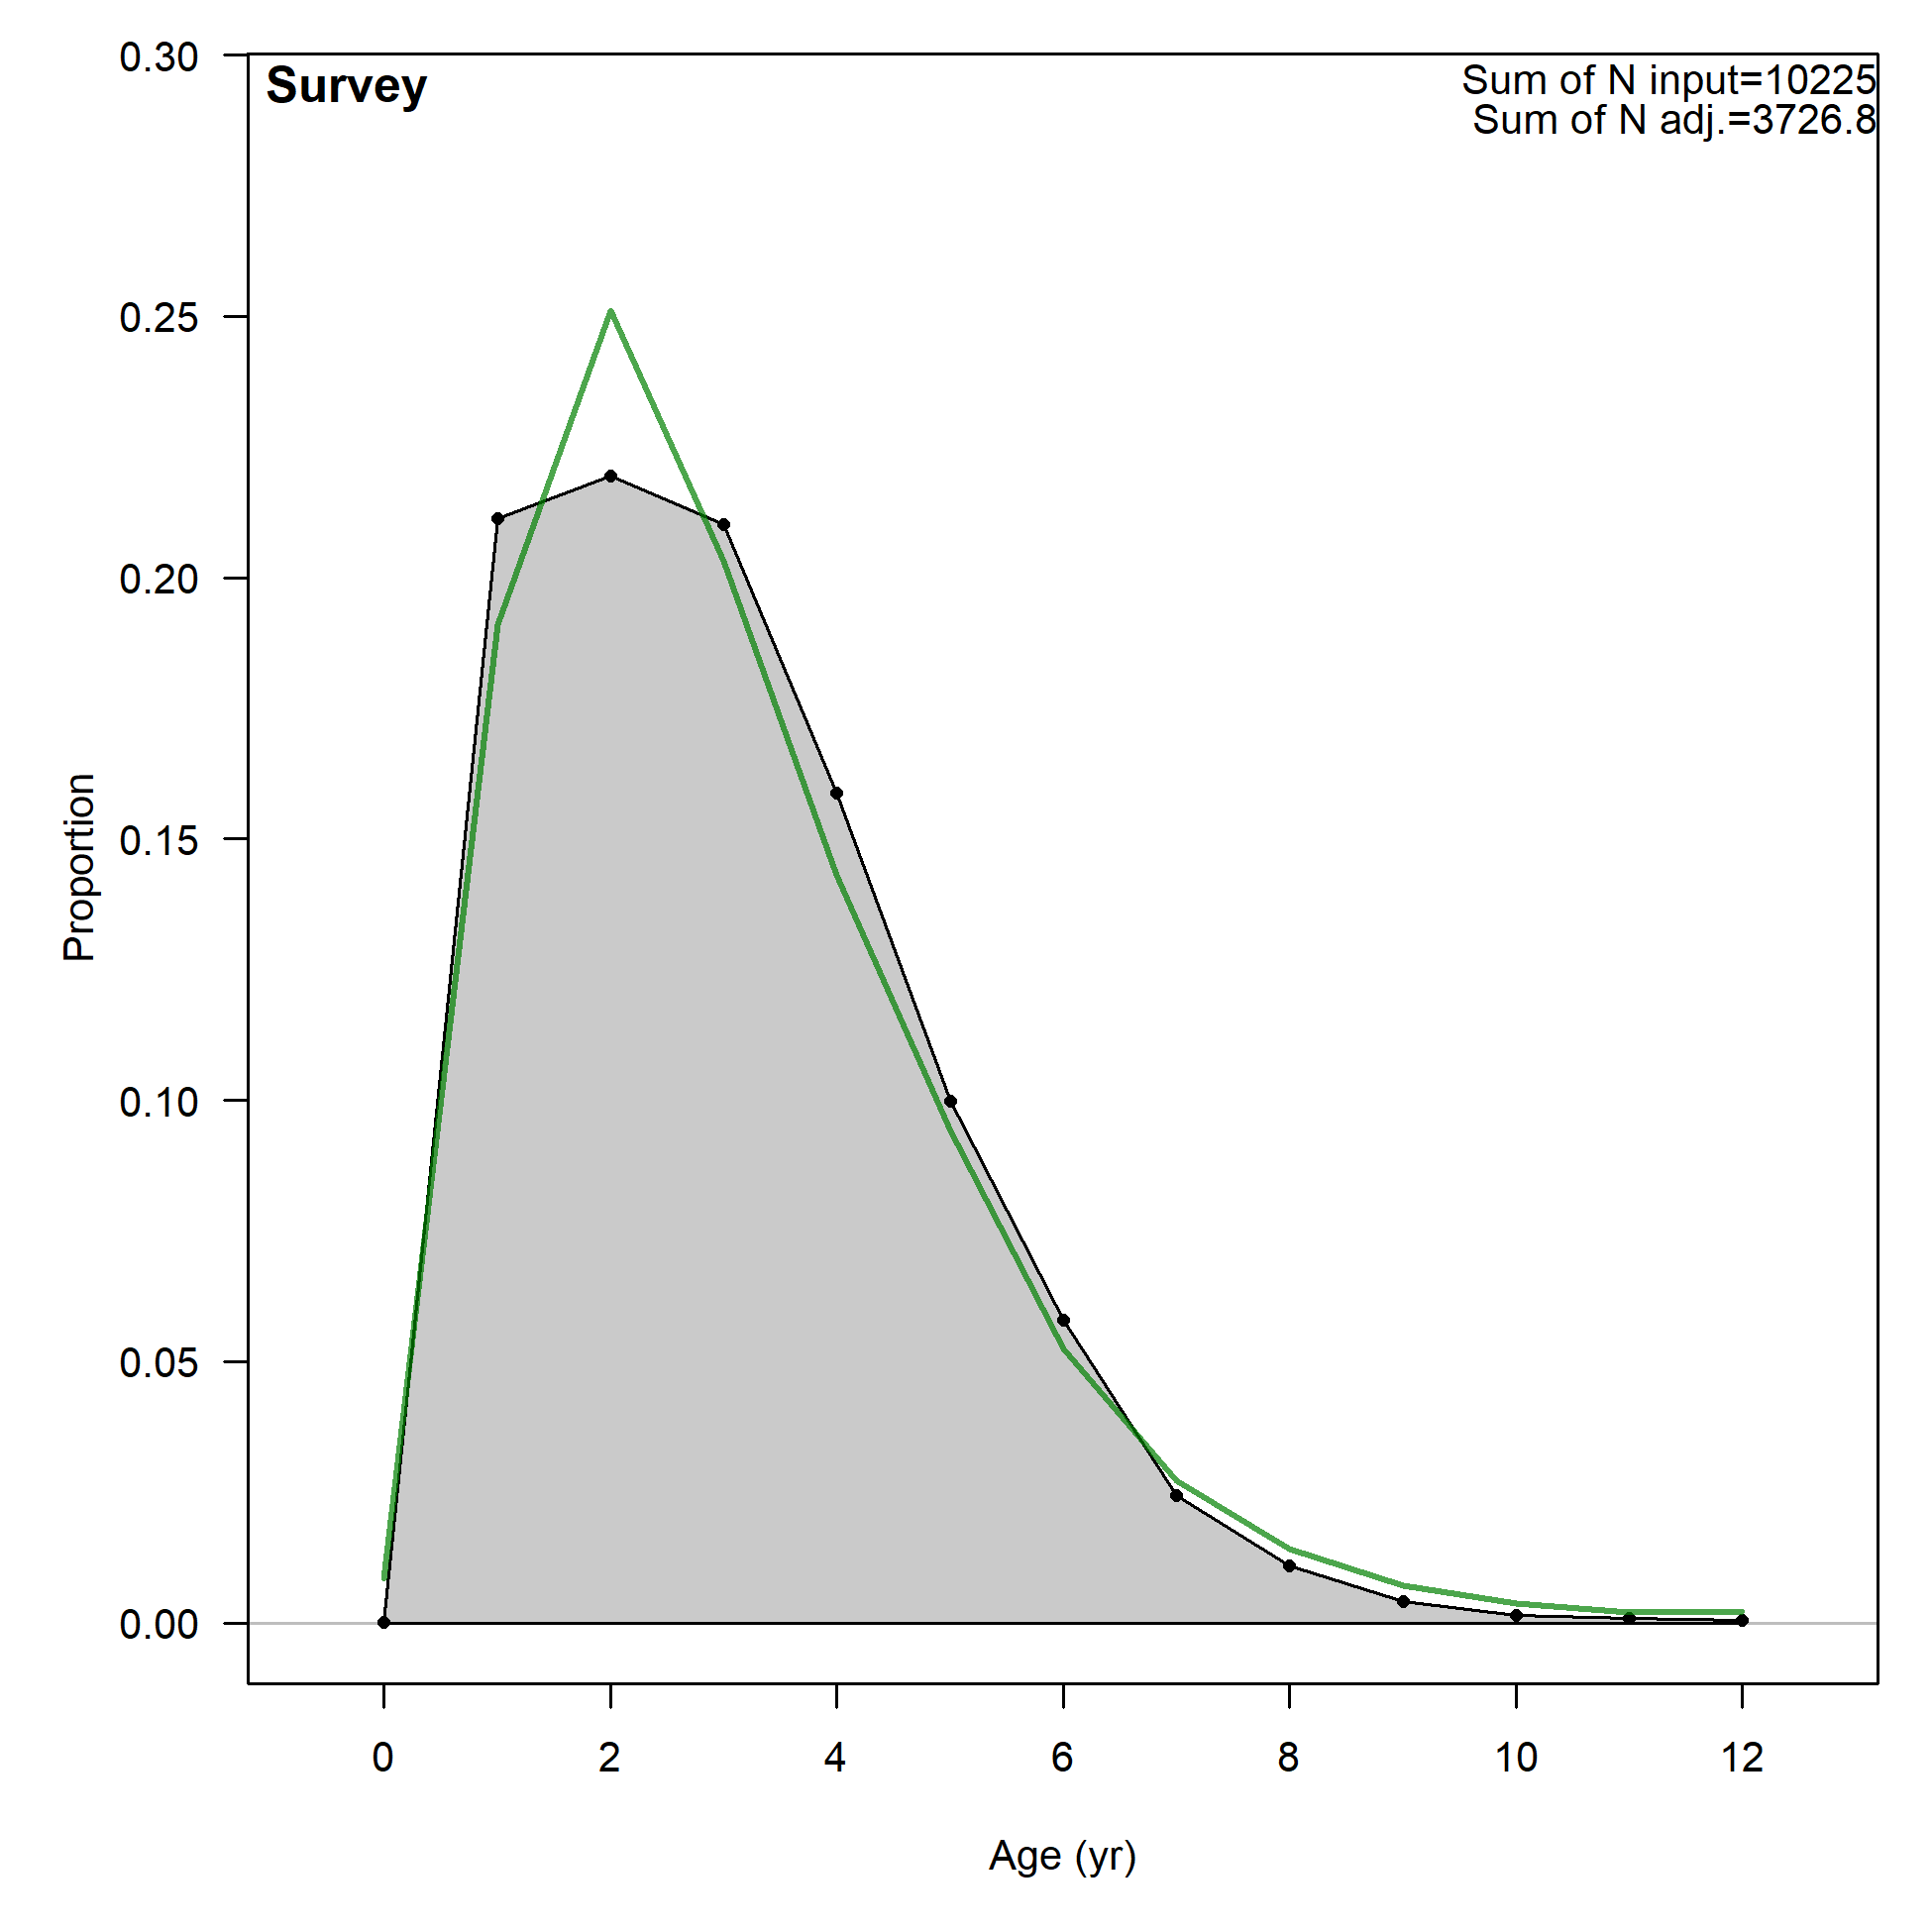
Age comps, aggregated across time by fleet.
Labels 'retained' and 'discard' indicate discarded or retained sampled for each fleet. Panels without this designation represent the whole catch.
file: comp_agefit__aggregated_across_time.png
Age comps, aggregated across time by fleet.
Labels 'retained' and 'discard' indicate discarded or retained sampled for each fleet. Panels without this designation represent the whole catch.
file: comp_agefit__aggregated_across_time.png
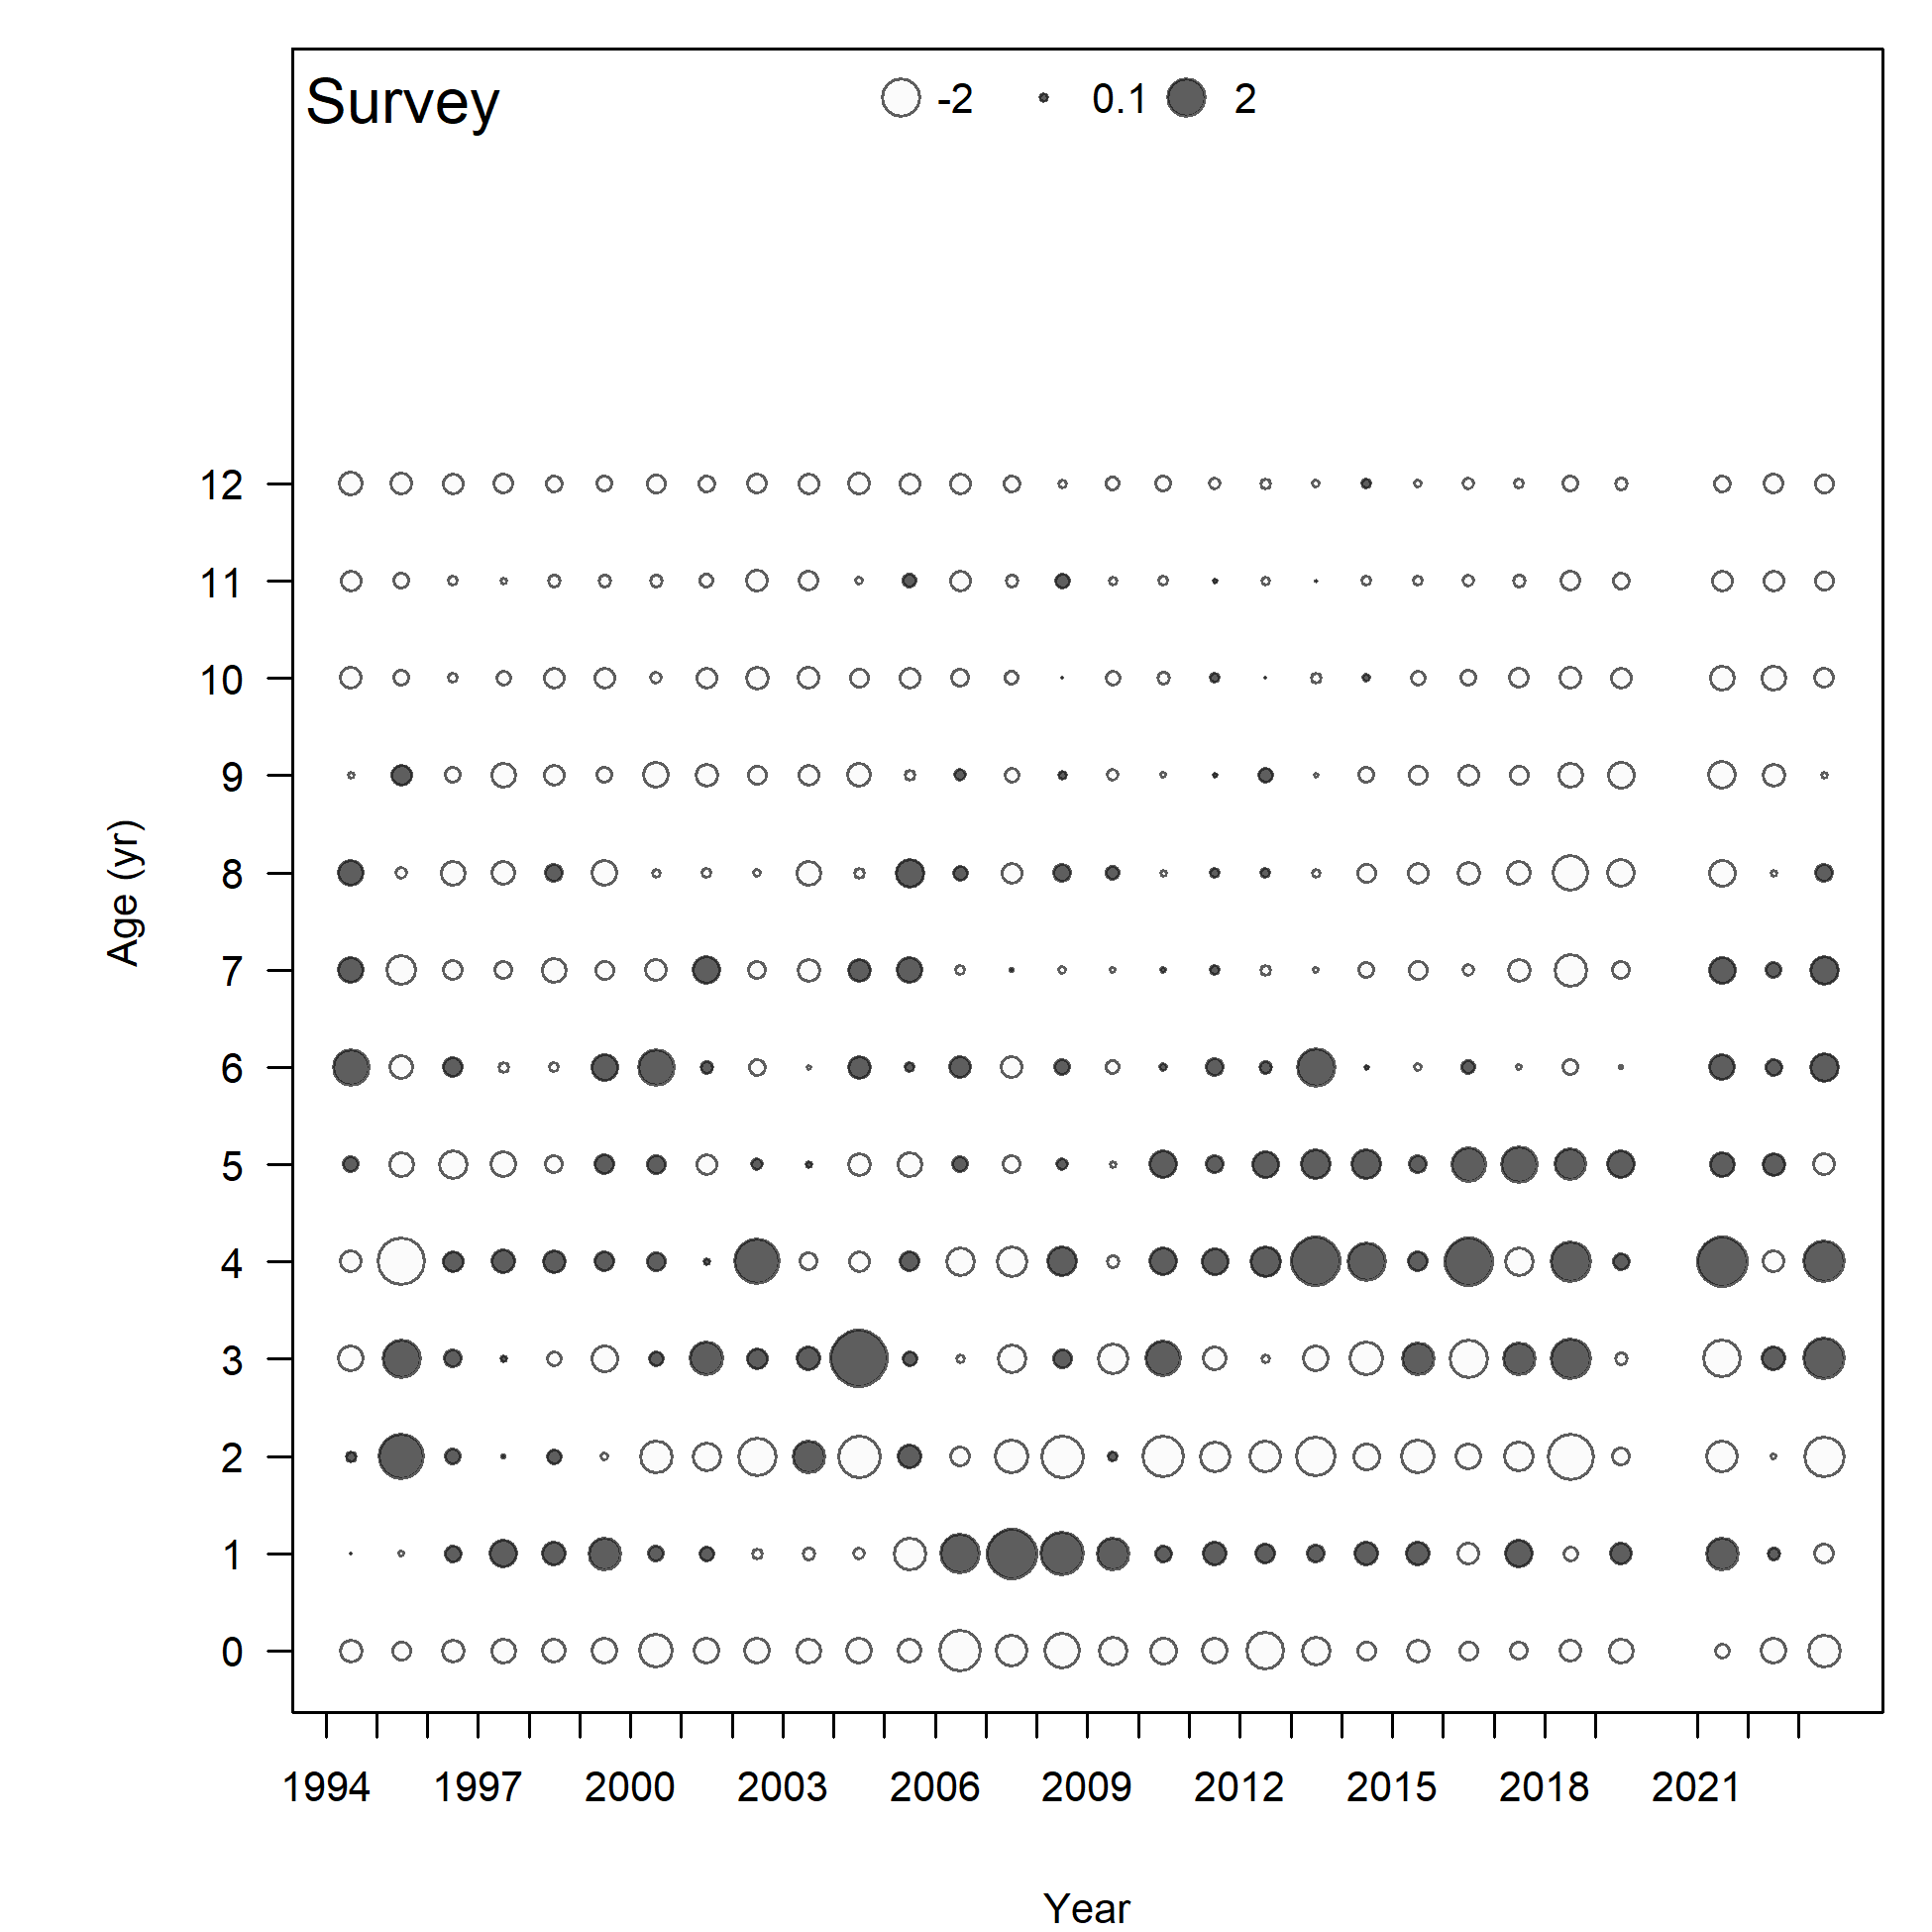
Pearson residuals, comparing across fleets
Closed bubbles are positive residuals (observed > expected) and open bubbles are negative residuals (observed < expected).
file: comp_agefit__multi-fleet_comparison.png
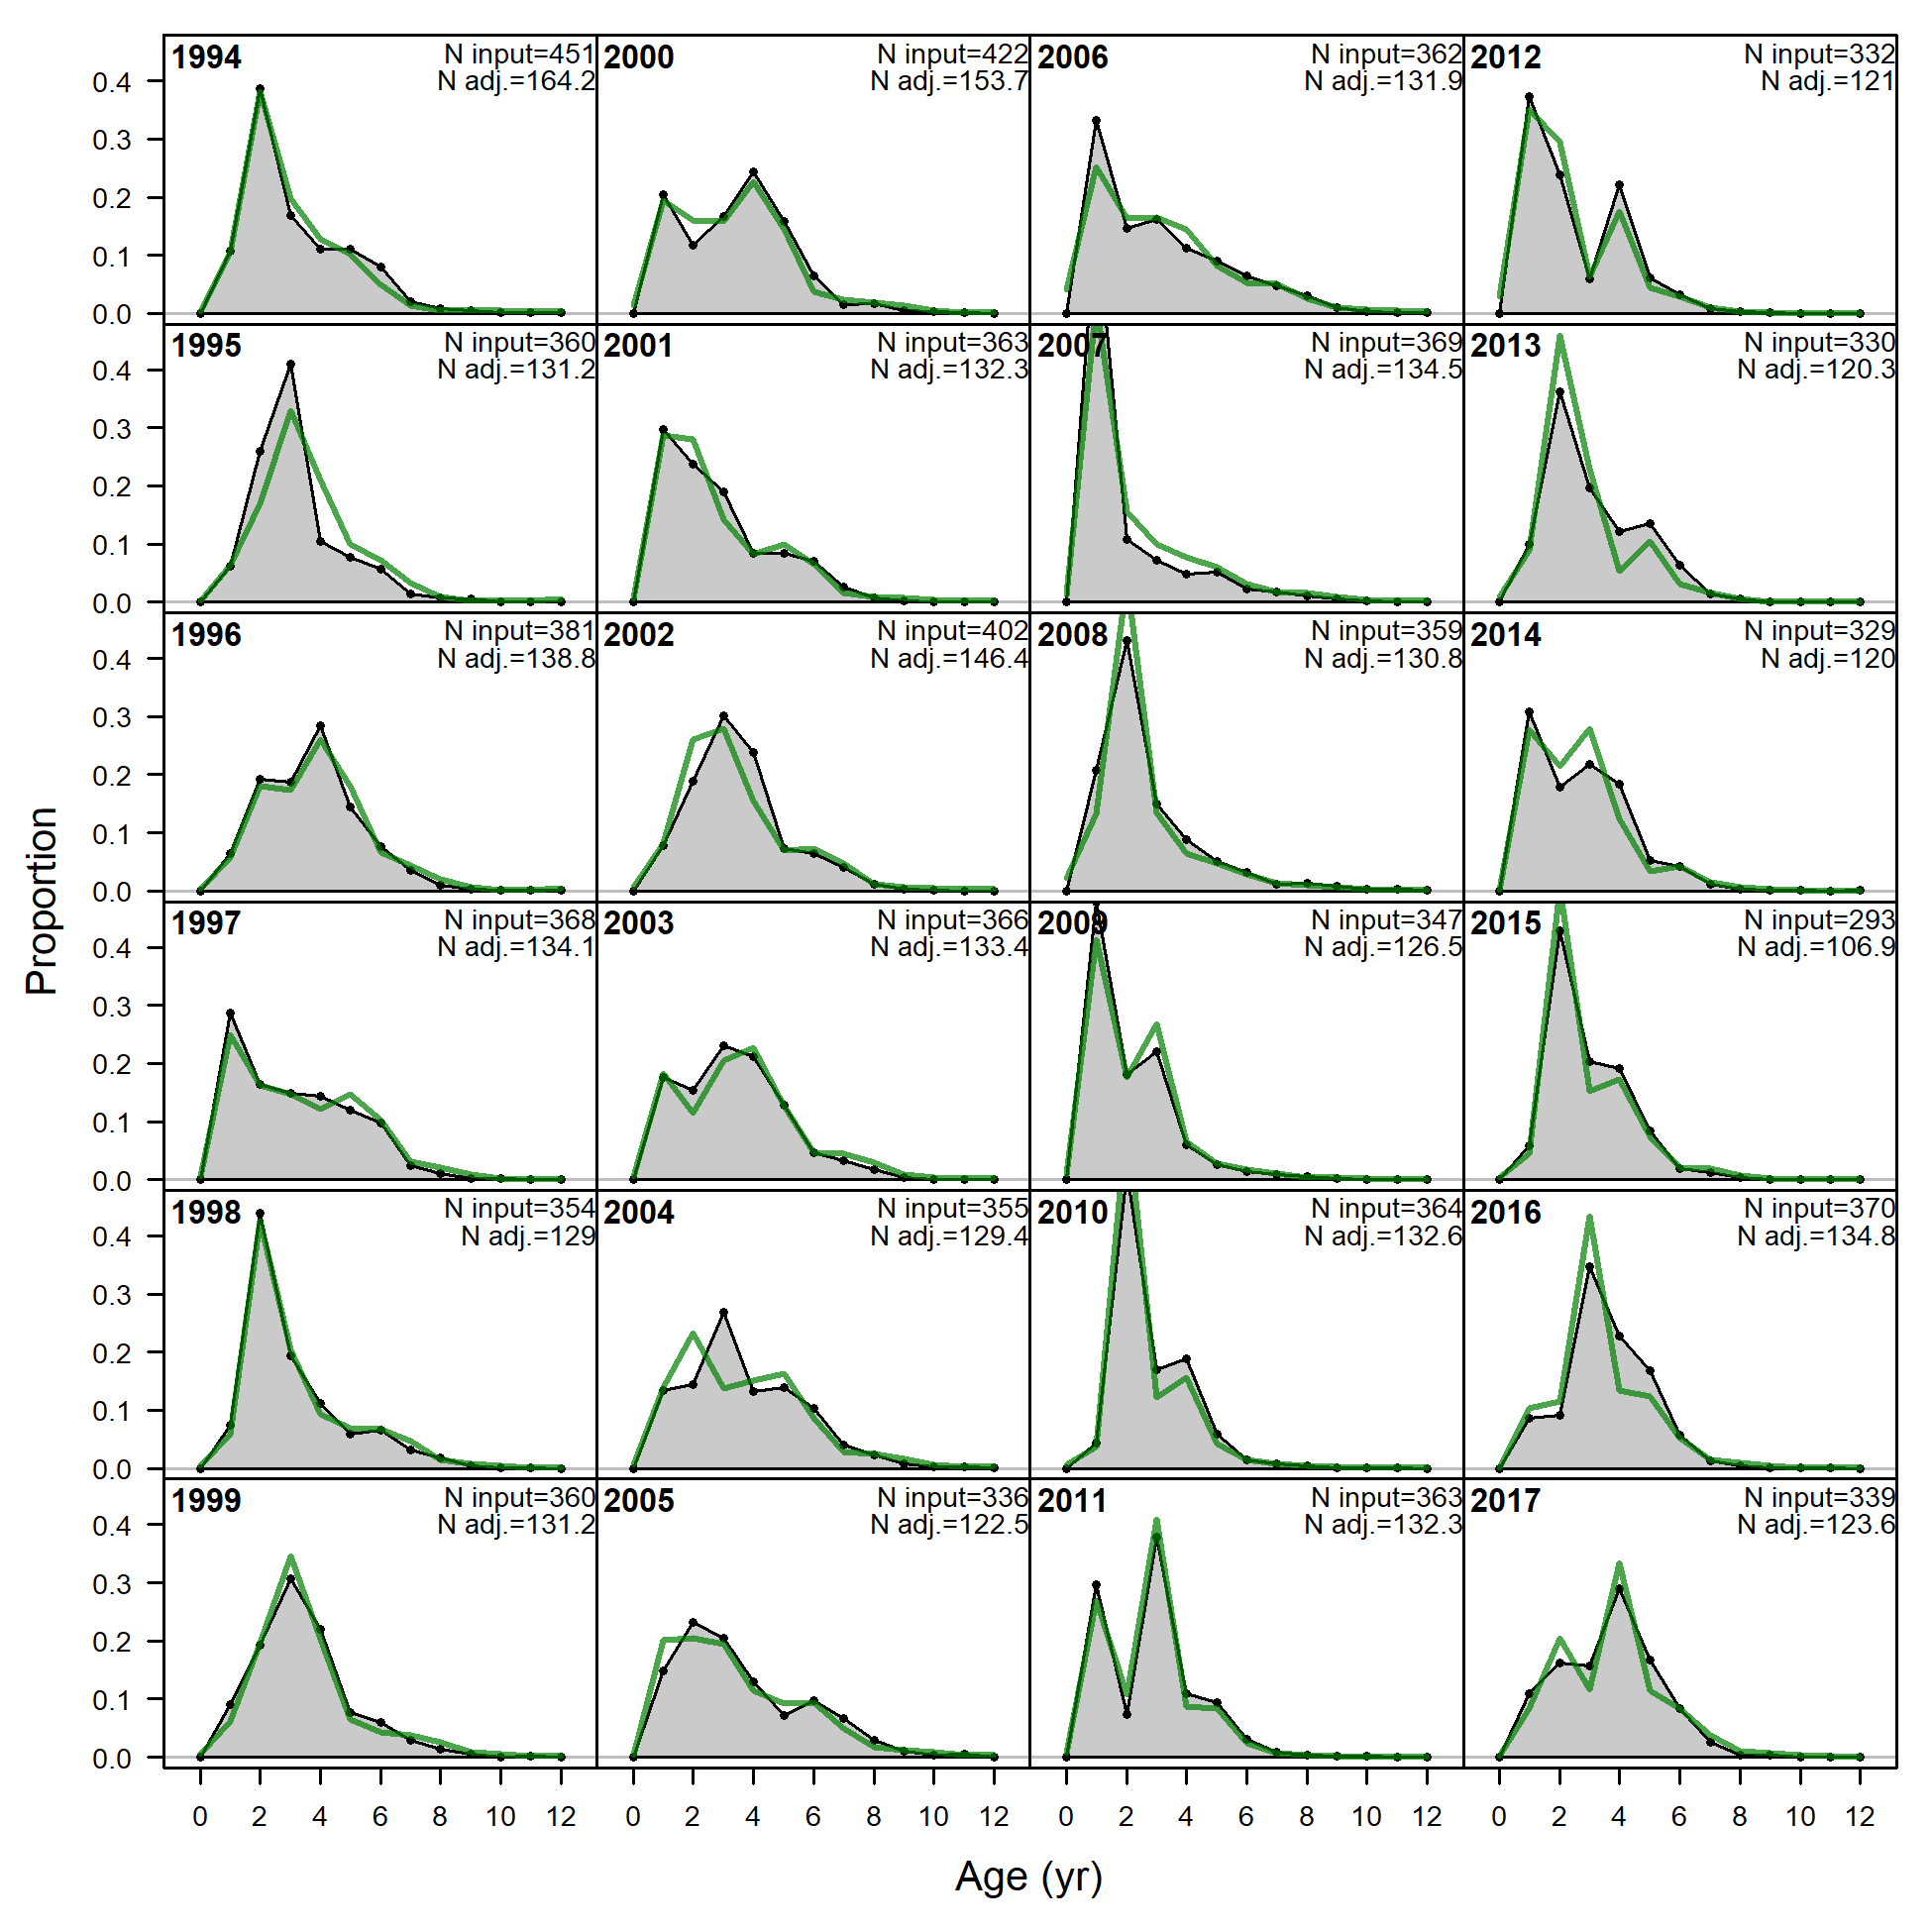
Age comps, whole catch, Survey (plot 1 of 2).
'N input' is the input sample size. 'N adj.' is the sample size after adjustment by the Dirichlet-Multinomial Θ parameter based on the formula N adj. = 1 / (1+Θ) + N * Θ / (1+Θ).
For this fleet, Θ = 0.569 and the sample size multiplier is approximately Θ / (1+Θ) = 0.363
For more info, see
Thorson, J.T., Johnson, K.F., Methot, R.D. and Taylor, I.G. 2017. Model-based estimates of effective sample size in stock assessment models using the Dirichlet-multinomial distribution. Fisheries Research192: 84-93. https://doi.org/10.1016/j.fishres.2016.06.005
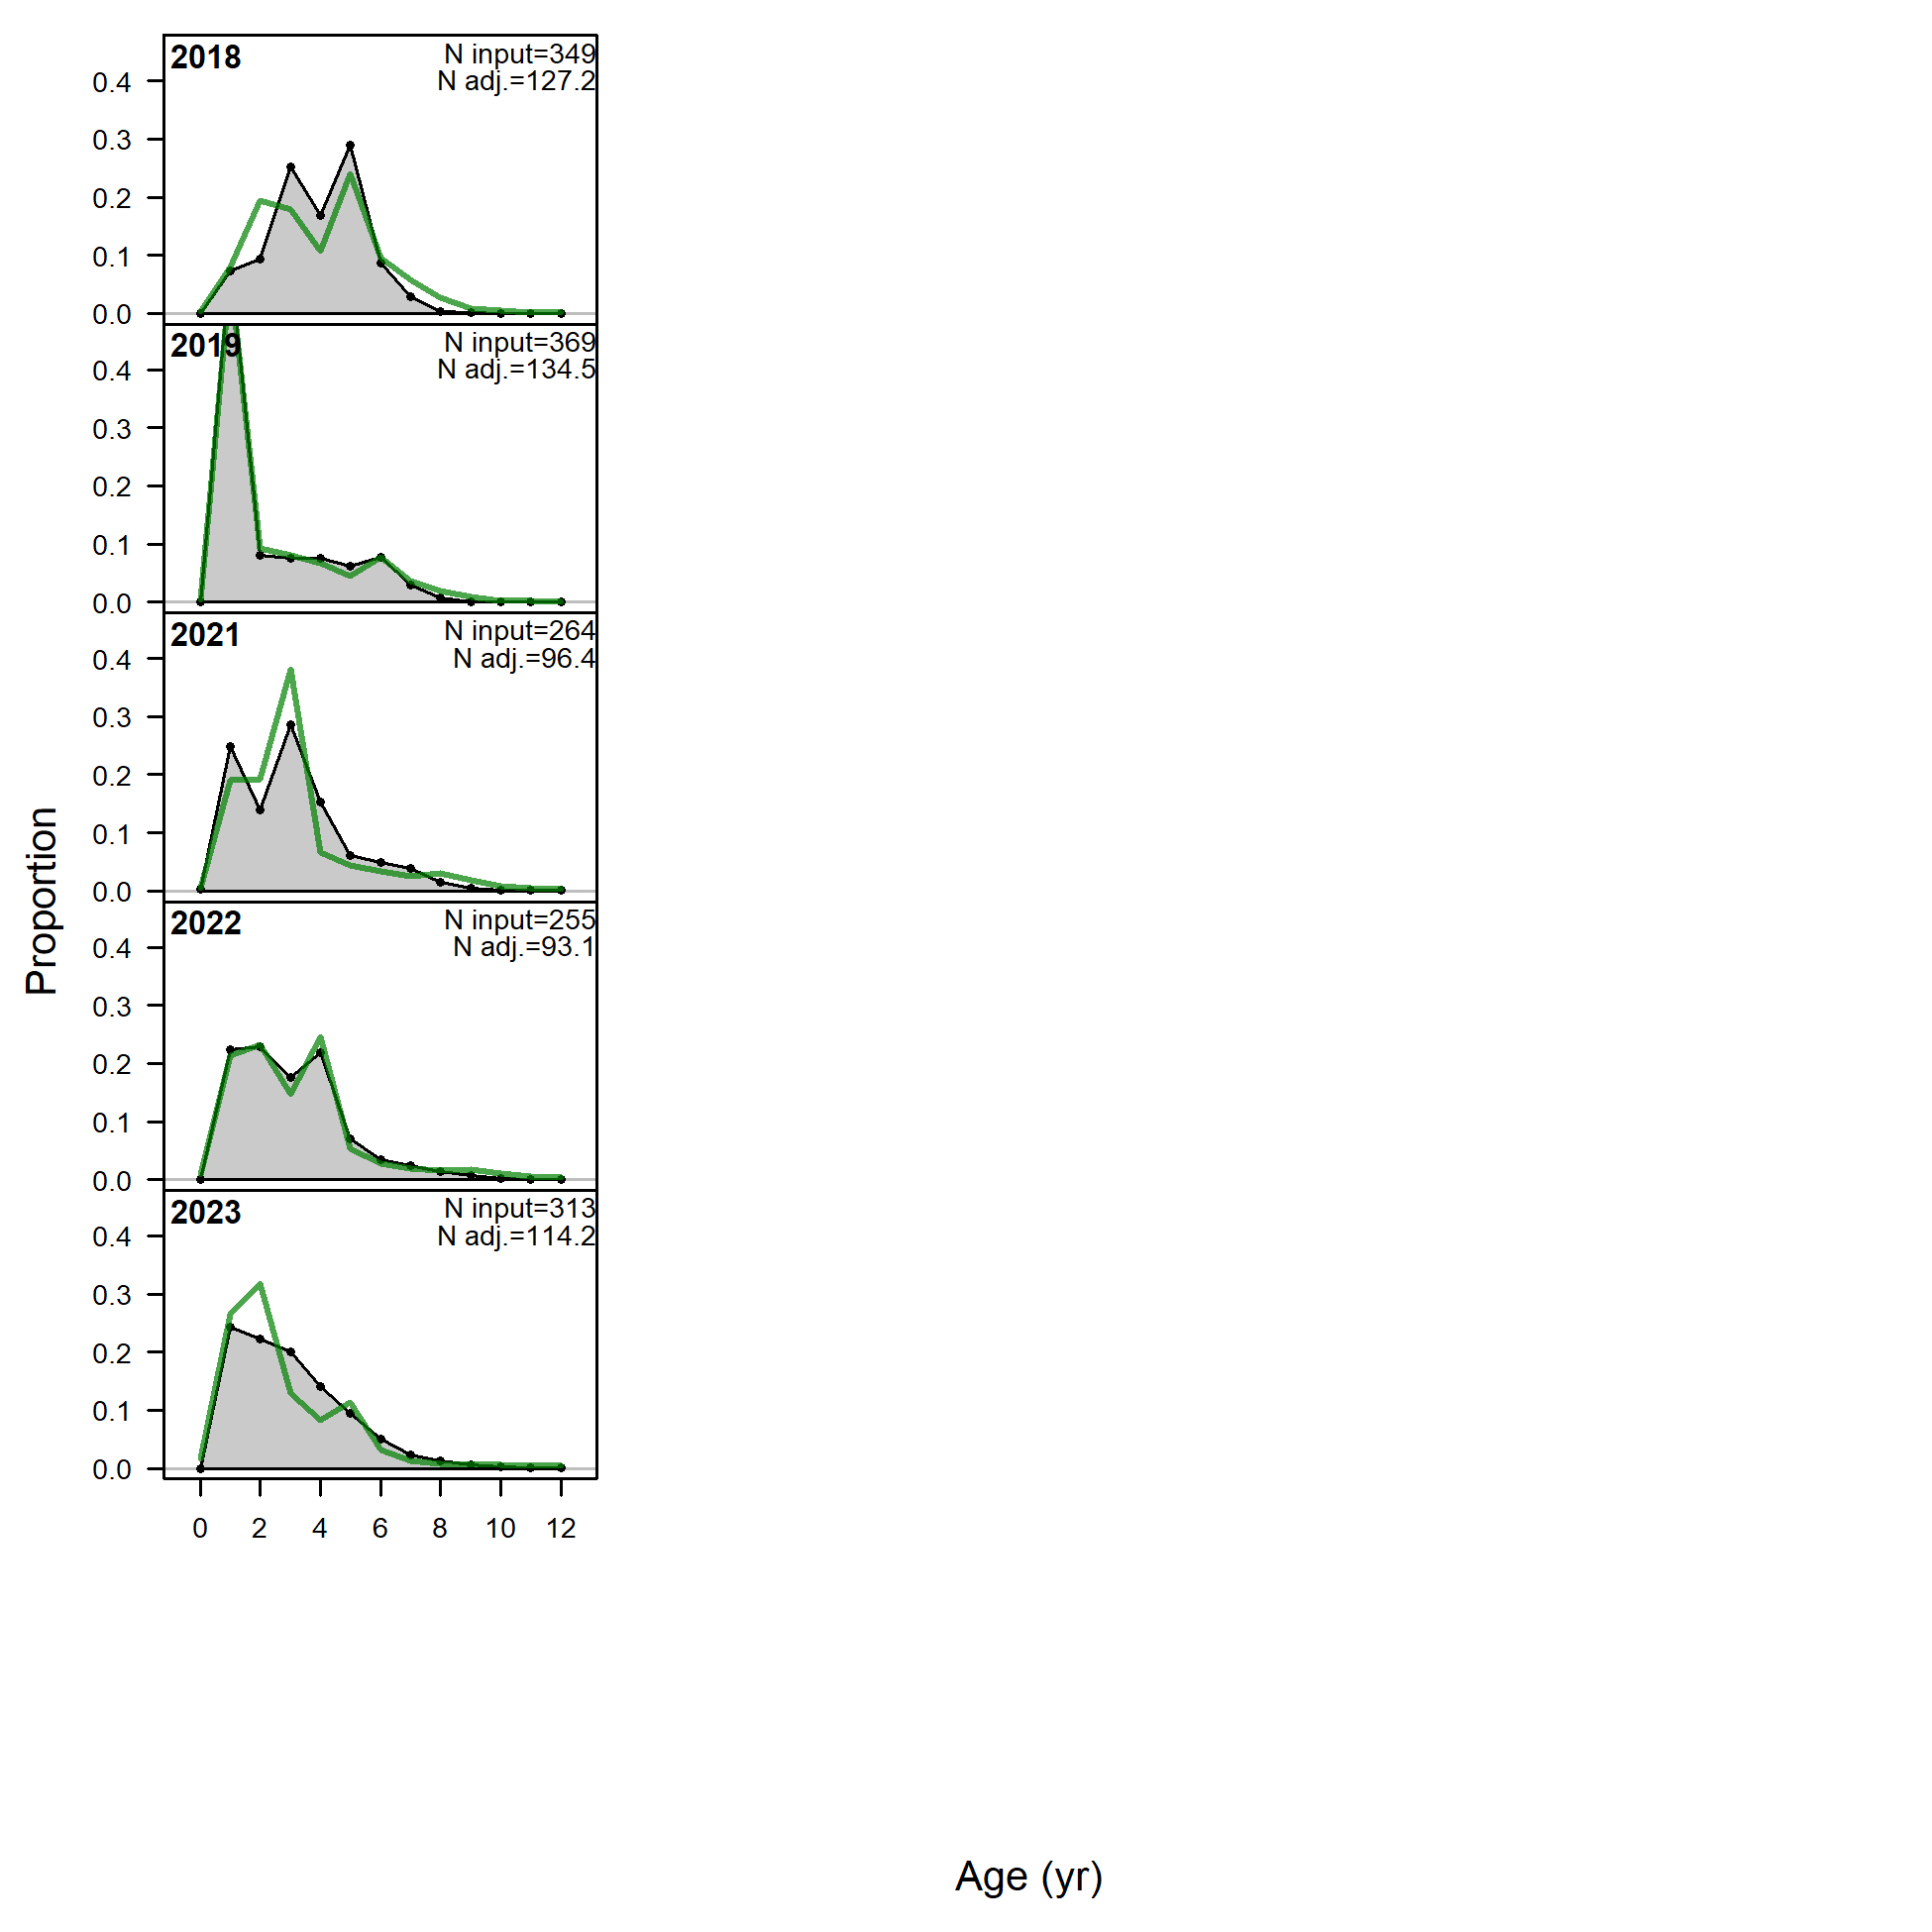
Age comps, whole catch, Survey (plot 1 of 2).
'N input' is the input sample size. 'N adj.' is the sample size after adjustment by the Dirichlet-Multinomial Θ parameter based on the formula N adj. = 1 / (1+Θ) + N * Θ / (1+Θ).
For this fleet, Θ = 0.569 and the sample size multiplier is approximately Θ / (1+Θ) = 0.363
For more info, see
Thorson, J.T., Johnson, K.F., Methot, R.D. and Taylor, I.G. 2017. Model-based estimates of effective sample size in stock assessment models using the Dirichlet-multinomial distribution. Fisheries Research192: 84-93. https://doi.org/10.1016/j.fishres.2016.06.005(plot 2 of 2)
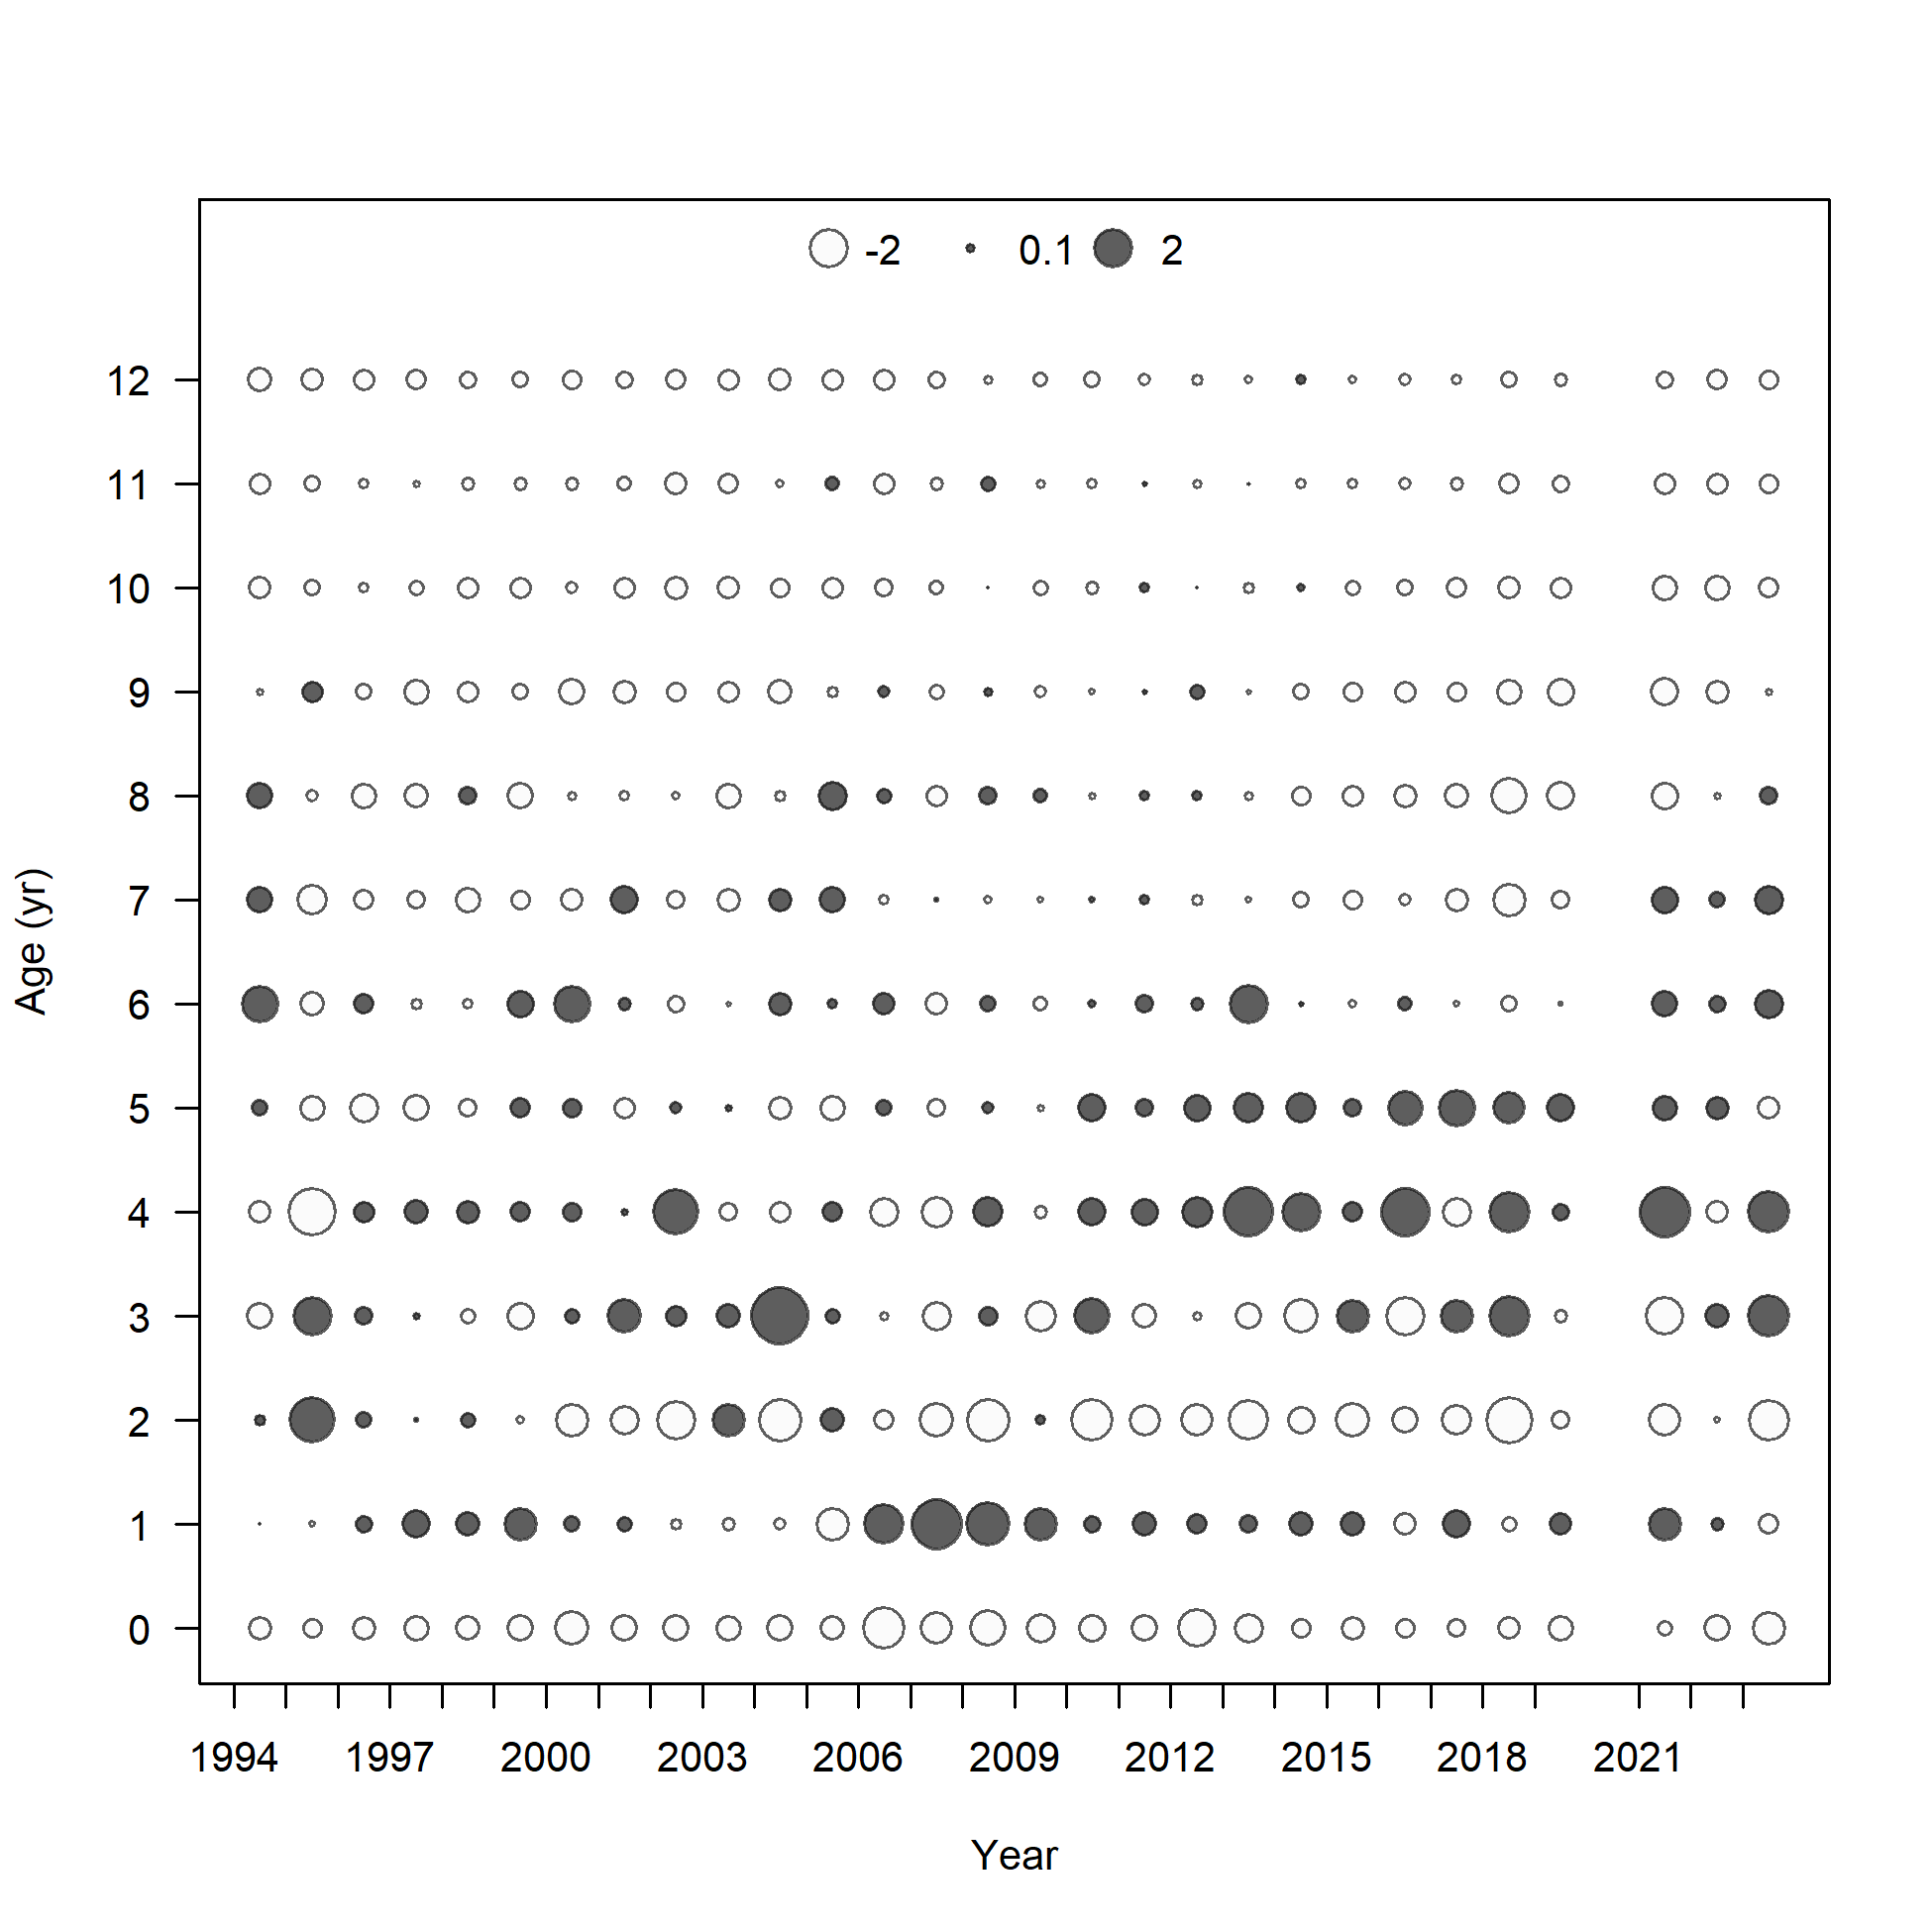
Pearson residuals, whole catch, Survey (max=4.33) (plot 2 of 2)
Closed bubbles are positive residuals (observed > expected) and open bubbles are negative residuals (observed < expected).
file: comp_agefit_residsflt2mkt0_page2.png
WARNING: this figure is based on multinomial likelihood and has not been updated to account for Dirichlet-Multinomial likelihood and the sample size adjustment associated with the estimated log(Θ) parameters.
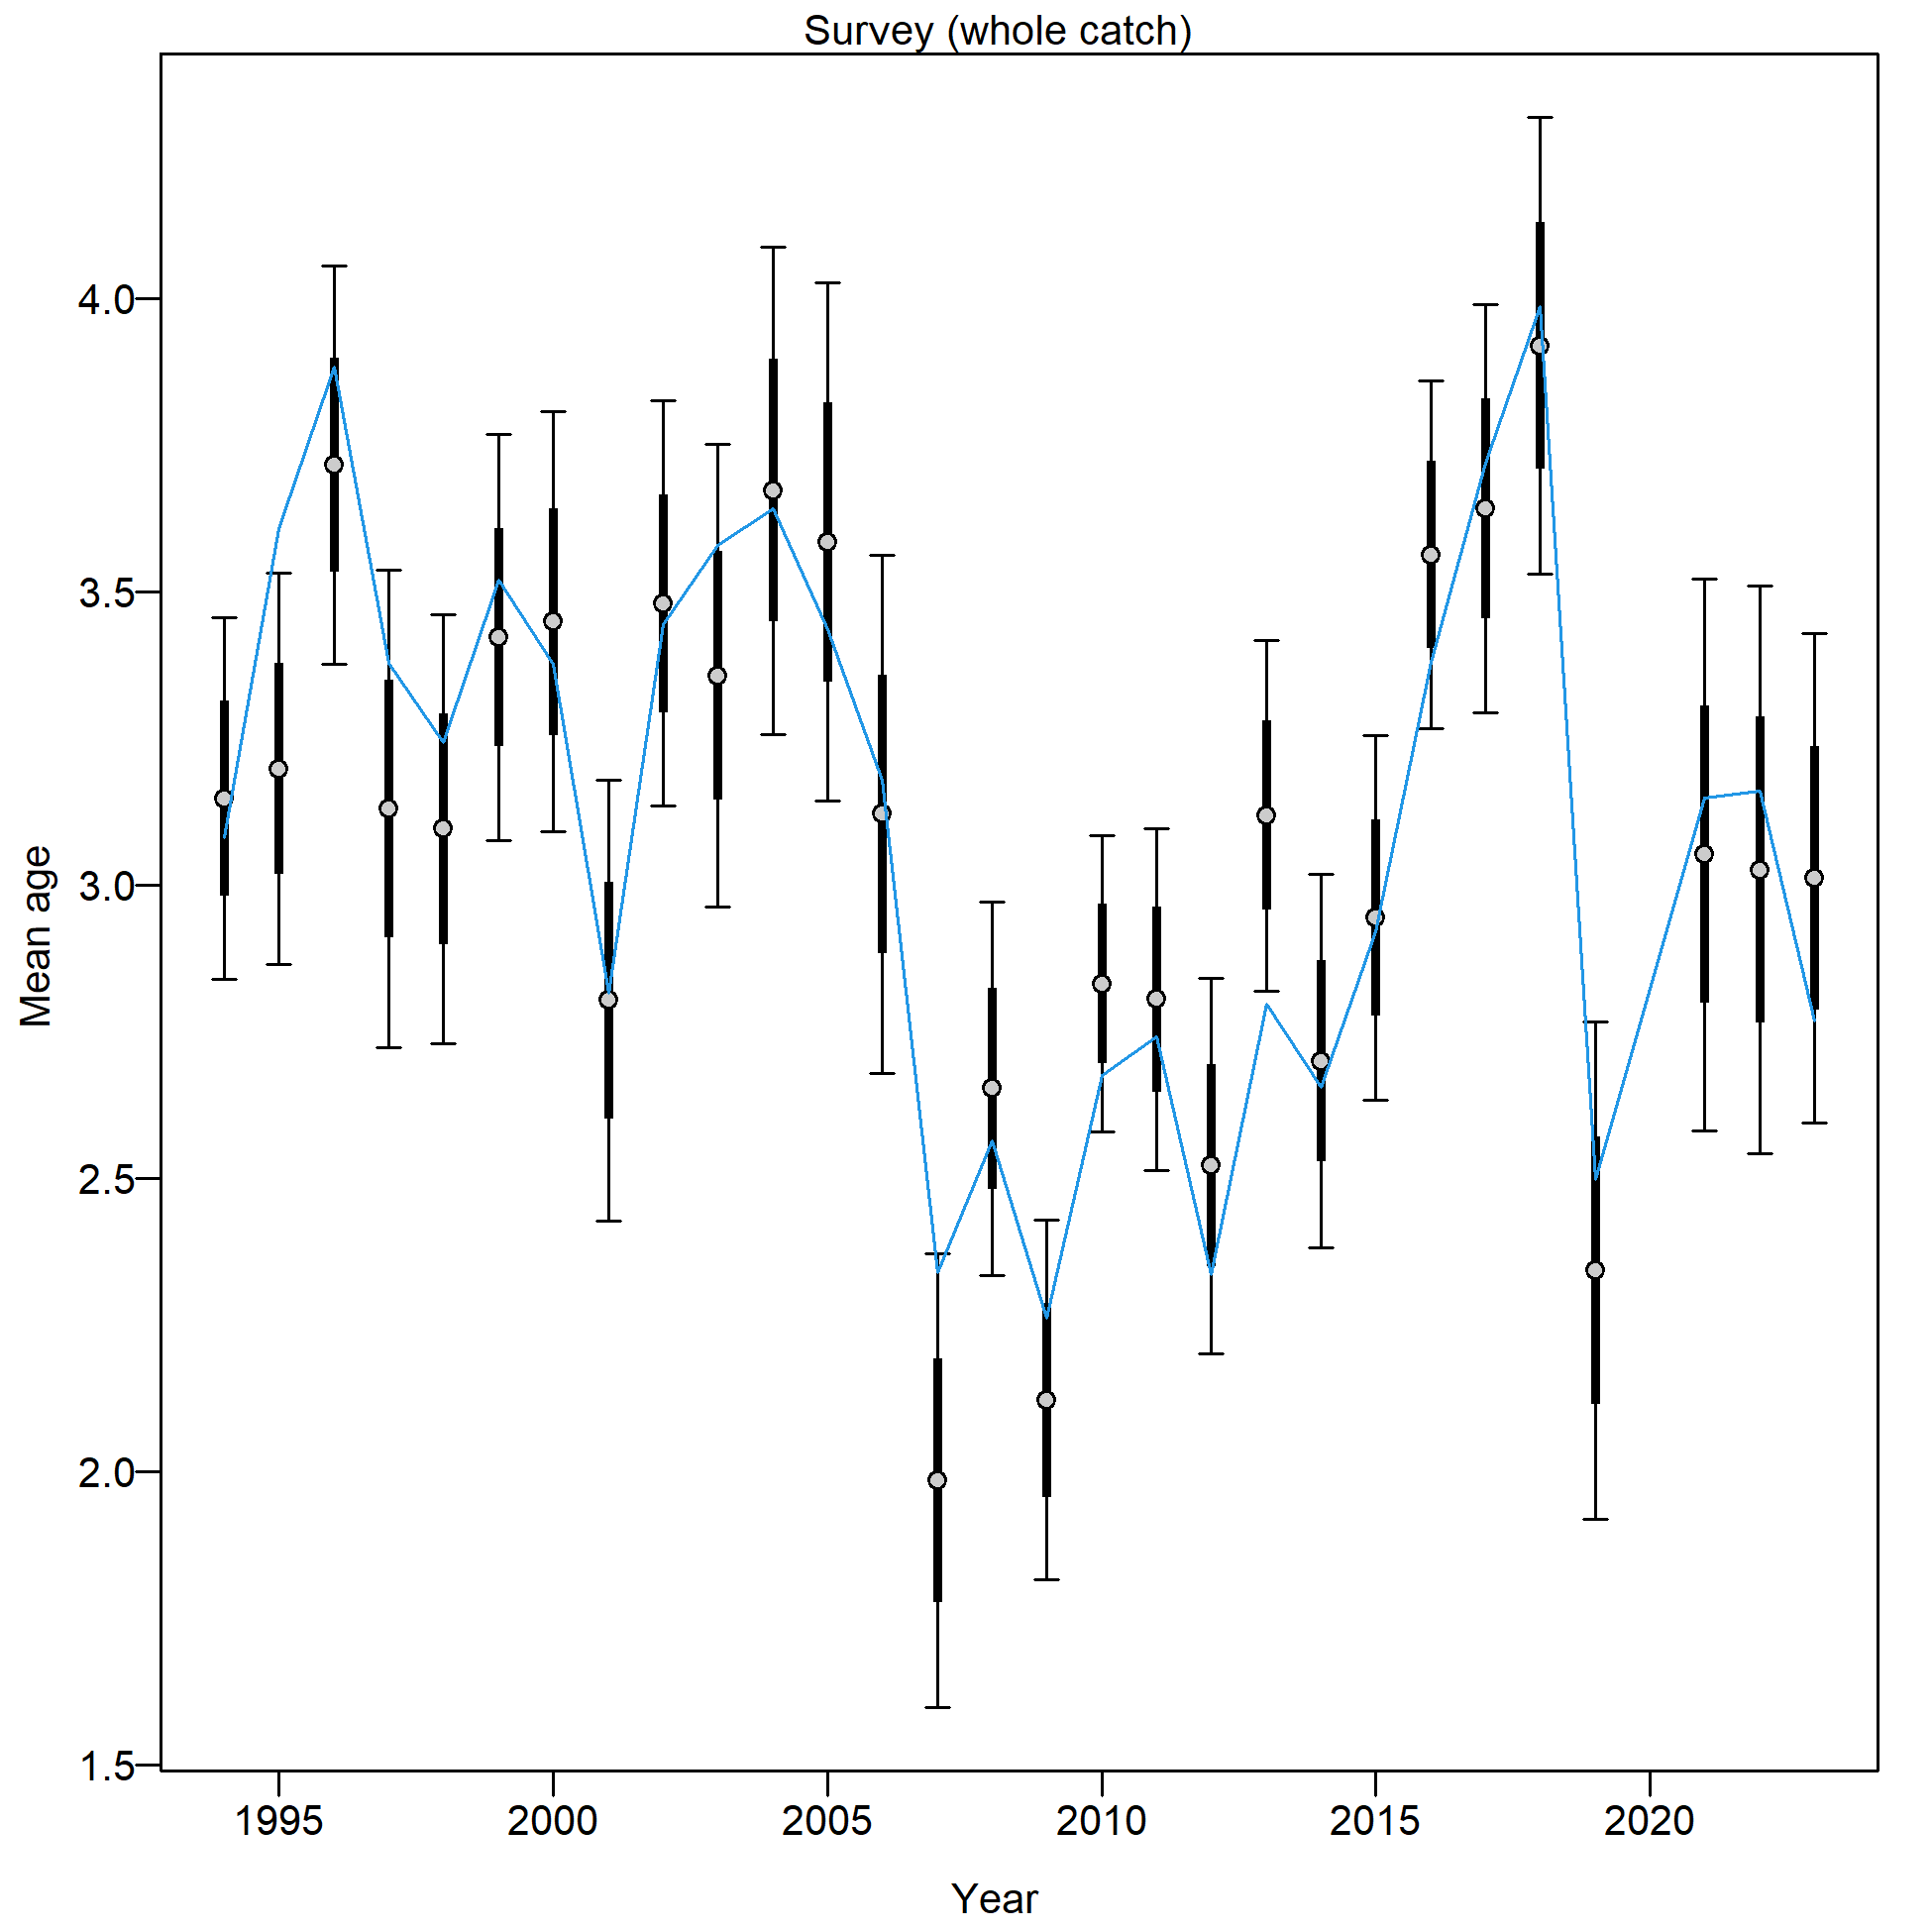
Mean age for Survey with 95% confidence intervals based on current samples sizes.
Francis data weighting method TA1.8: thinner intervals (with capped ends) show result of further adjusting sample sizes based on suggested multiplier (with 95% interval) for age data from Survey:
0.2902 (0.1881-0.5609)
For more info, see
Francis, R.I.C.C. (2011). Data weighting in statistical fisheries stock assessment models. Can. J. Fish. Aquat. Sci. 68: 1124-1138. https://doi.org/10.1139/f2011-025