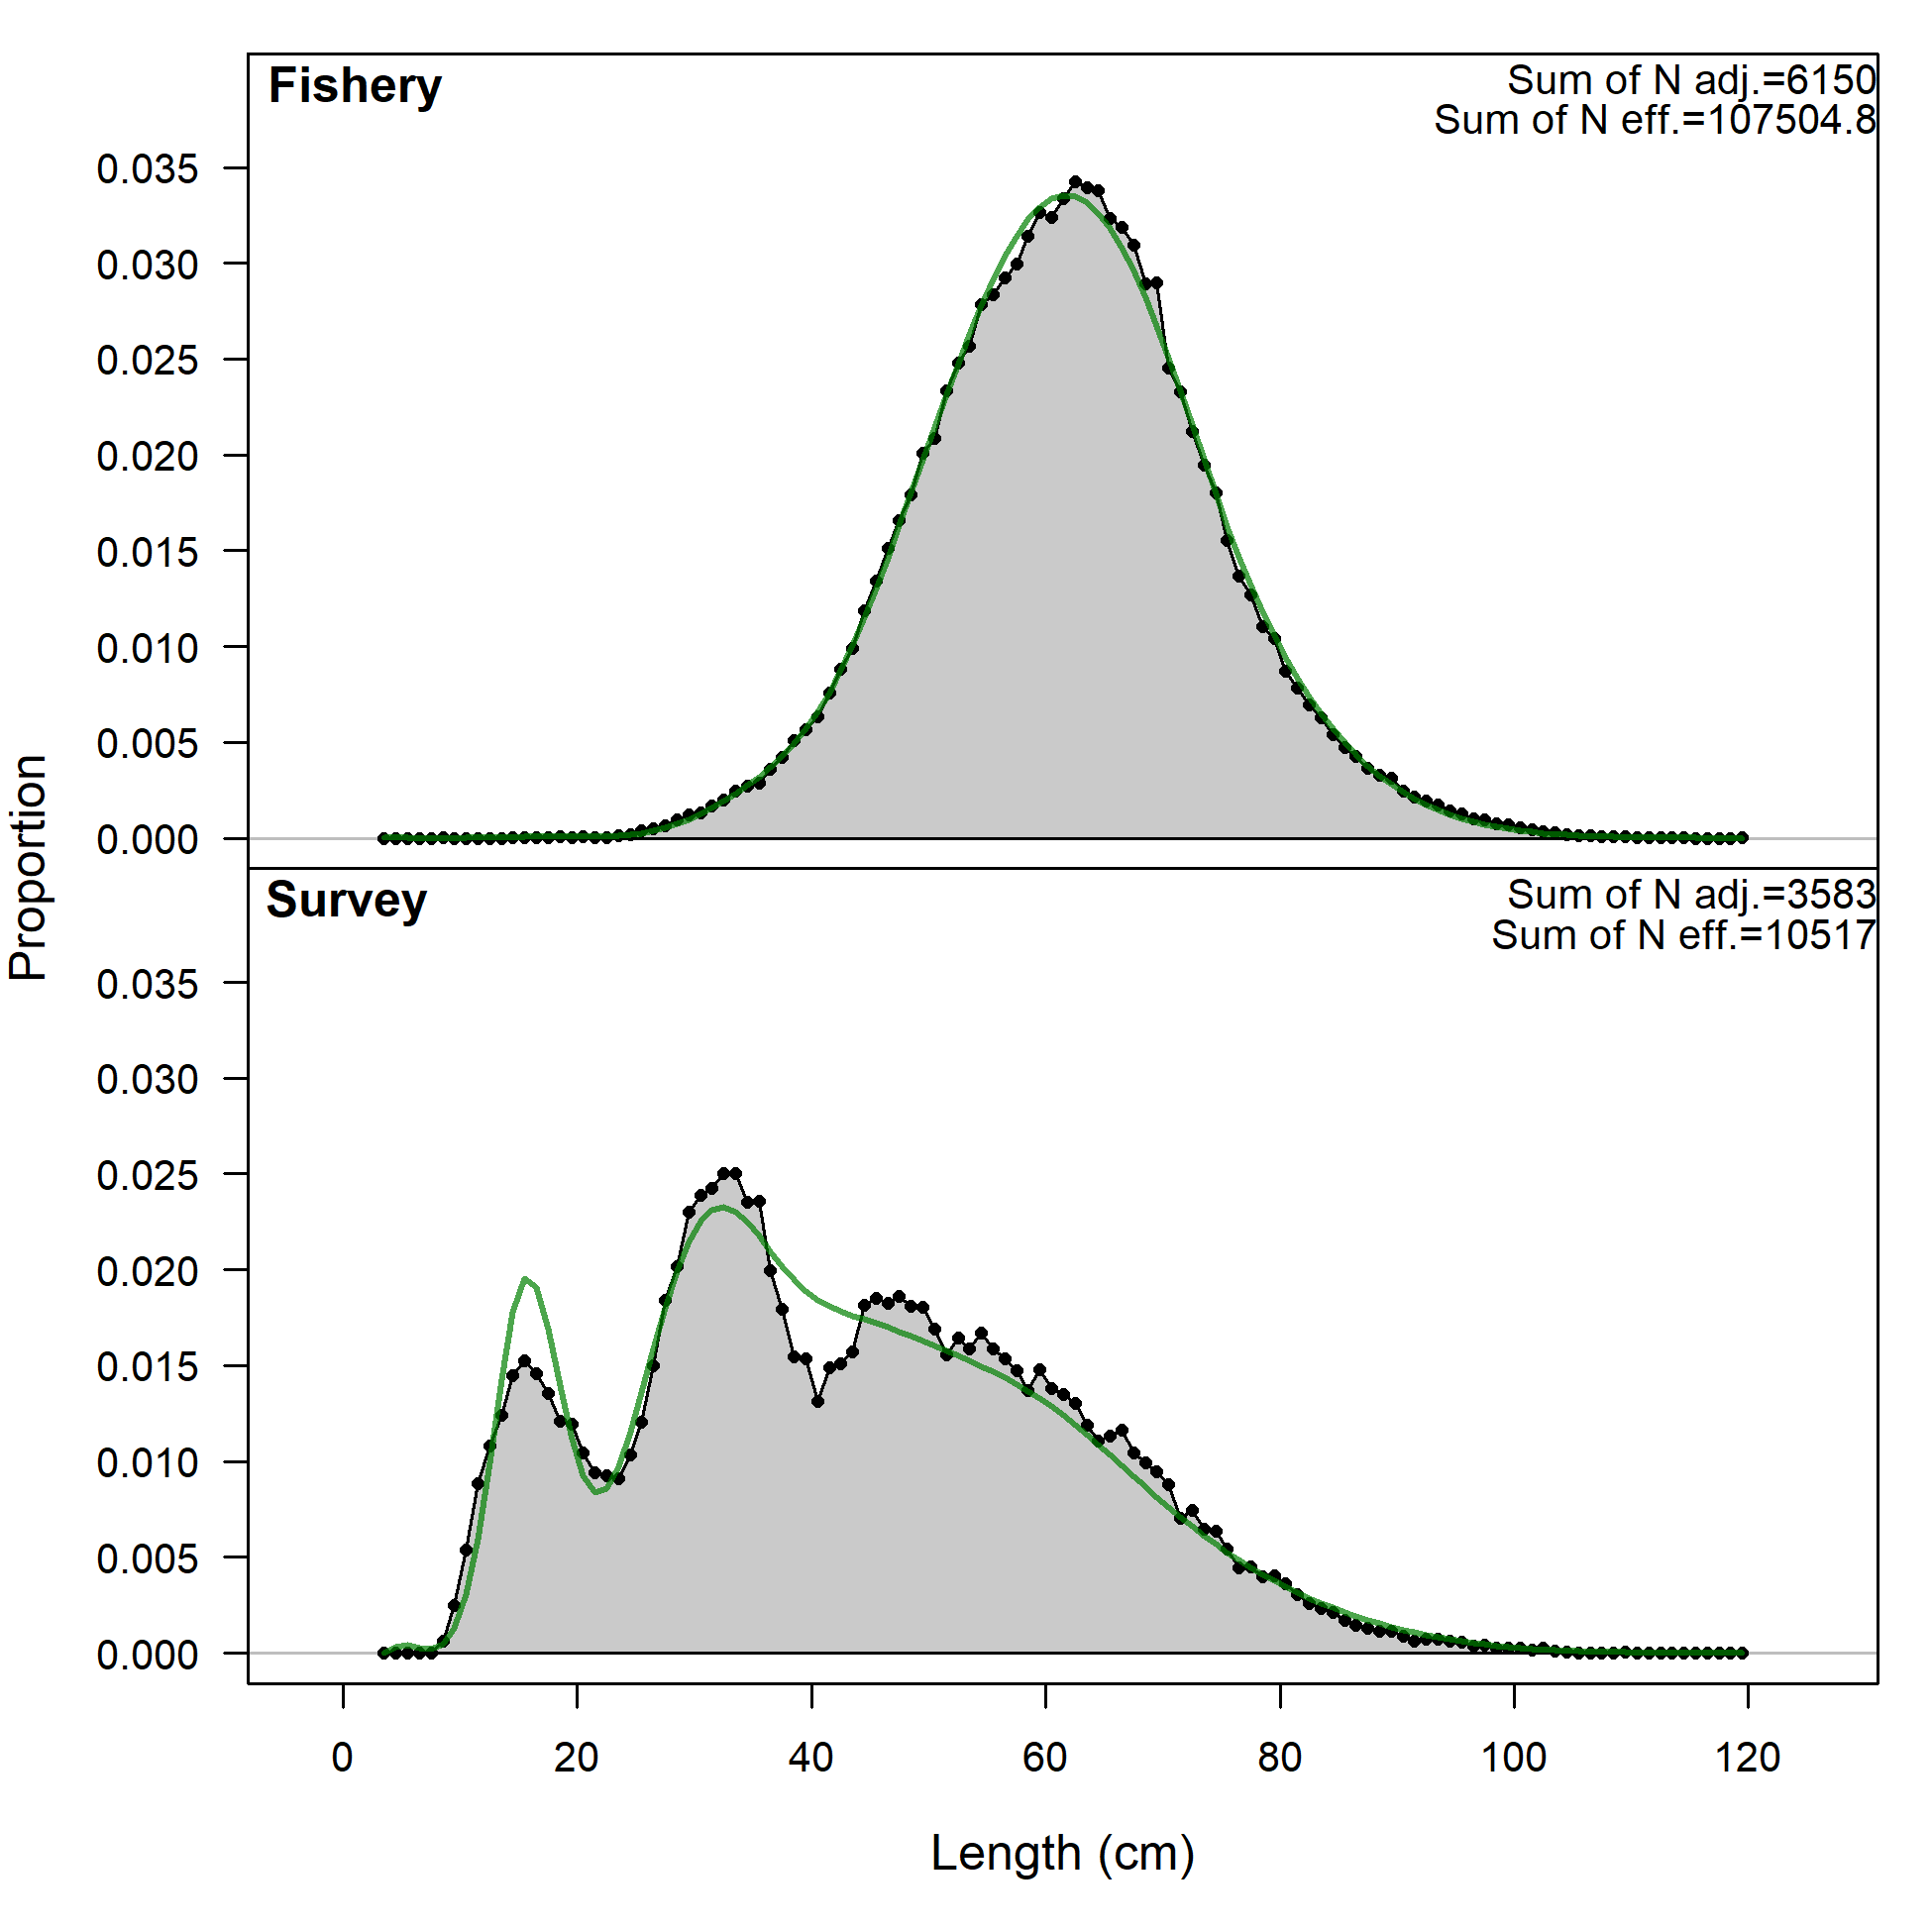
Length comps, aggregated across time by fleet.
Labels 'retained' and 'discard' indicate discarded or retained sampled for each fleet. Panels without this designation represent the whole catch.
file: comp_lenfit__aggregated_across_time.png
Length comps, aggregated across time by fleet.
Labels 'retained' and 'discard' indicate discarded or retained sampled for each fleet. Panels without this designation represent the whole catch.
file: comp_lenfit__aggregated_across_time.png
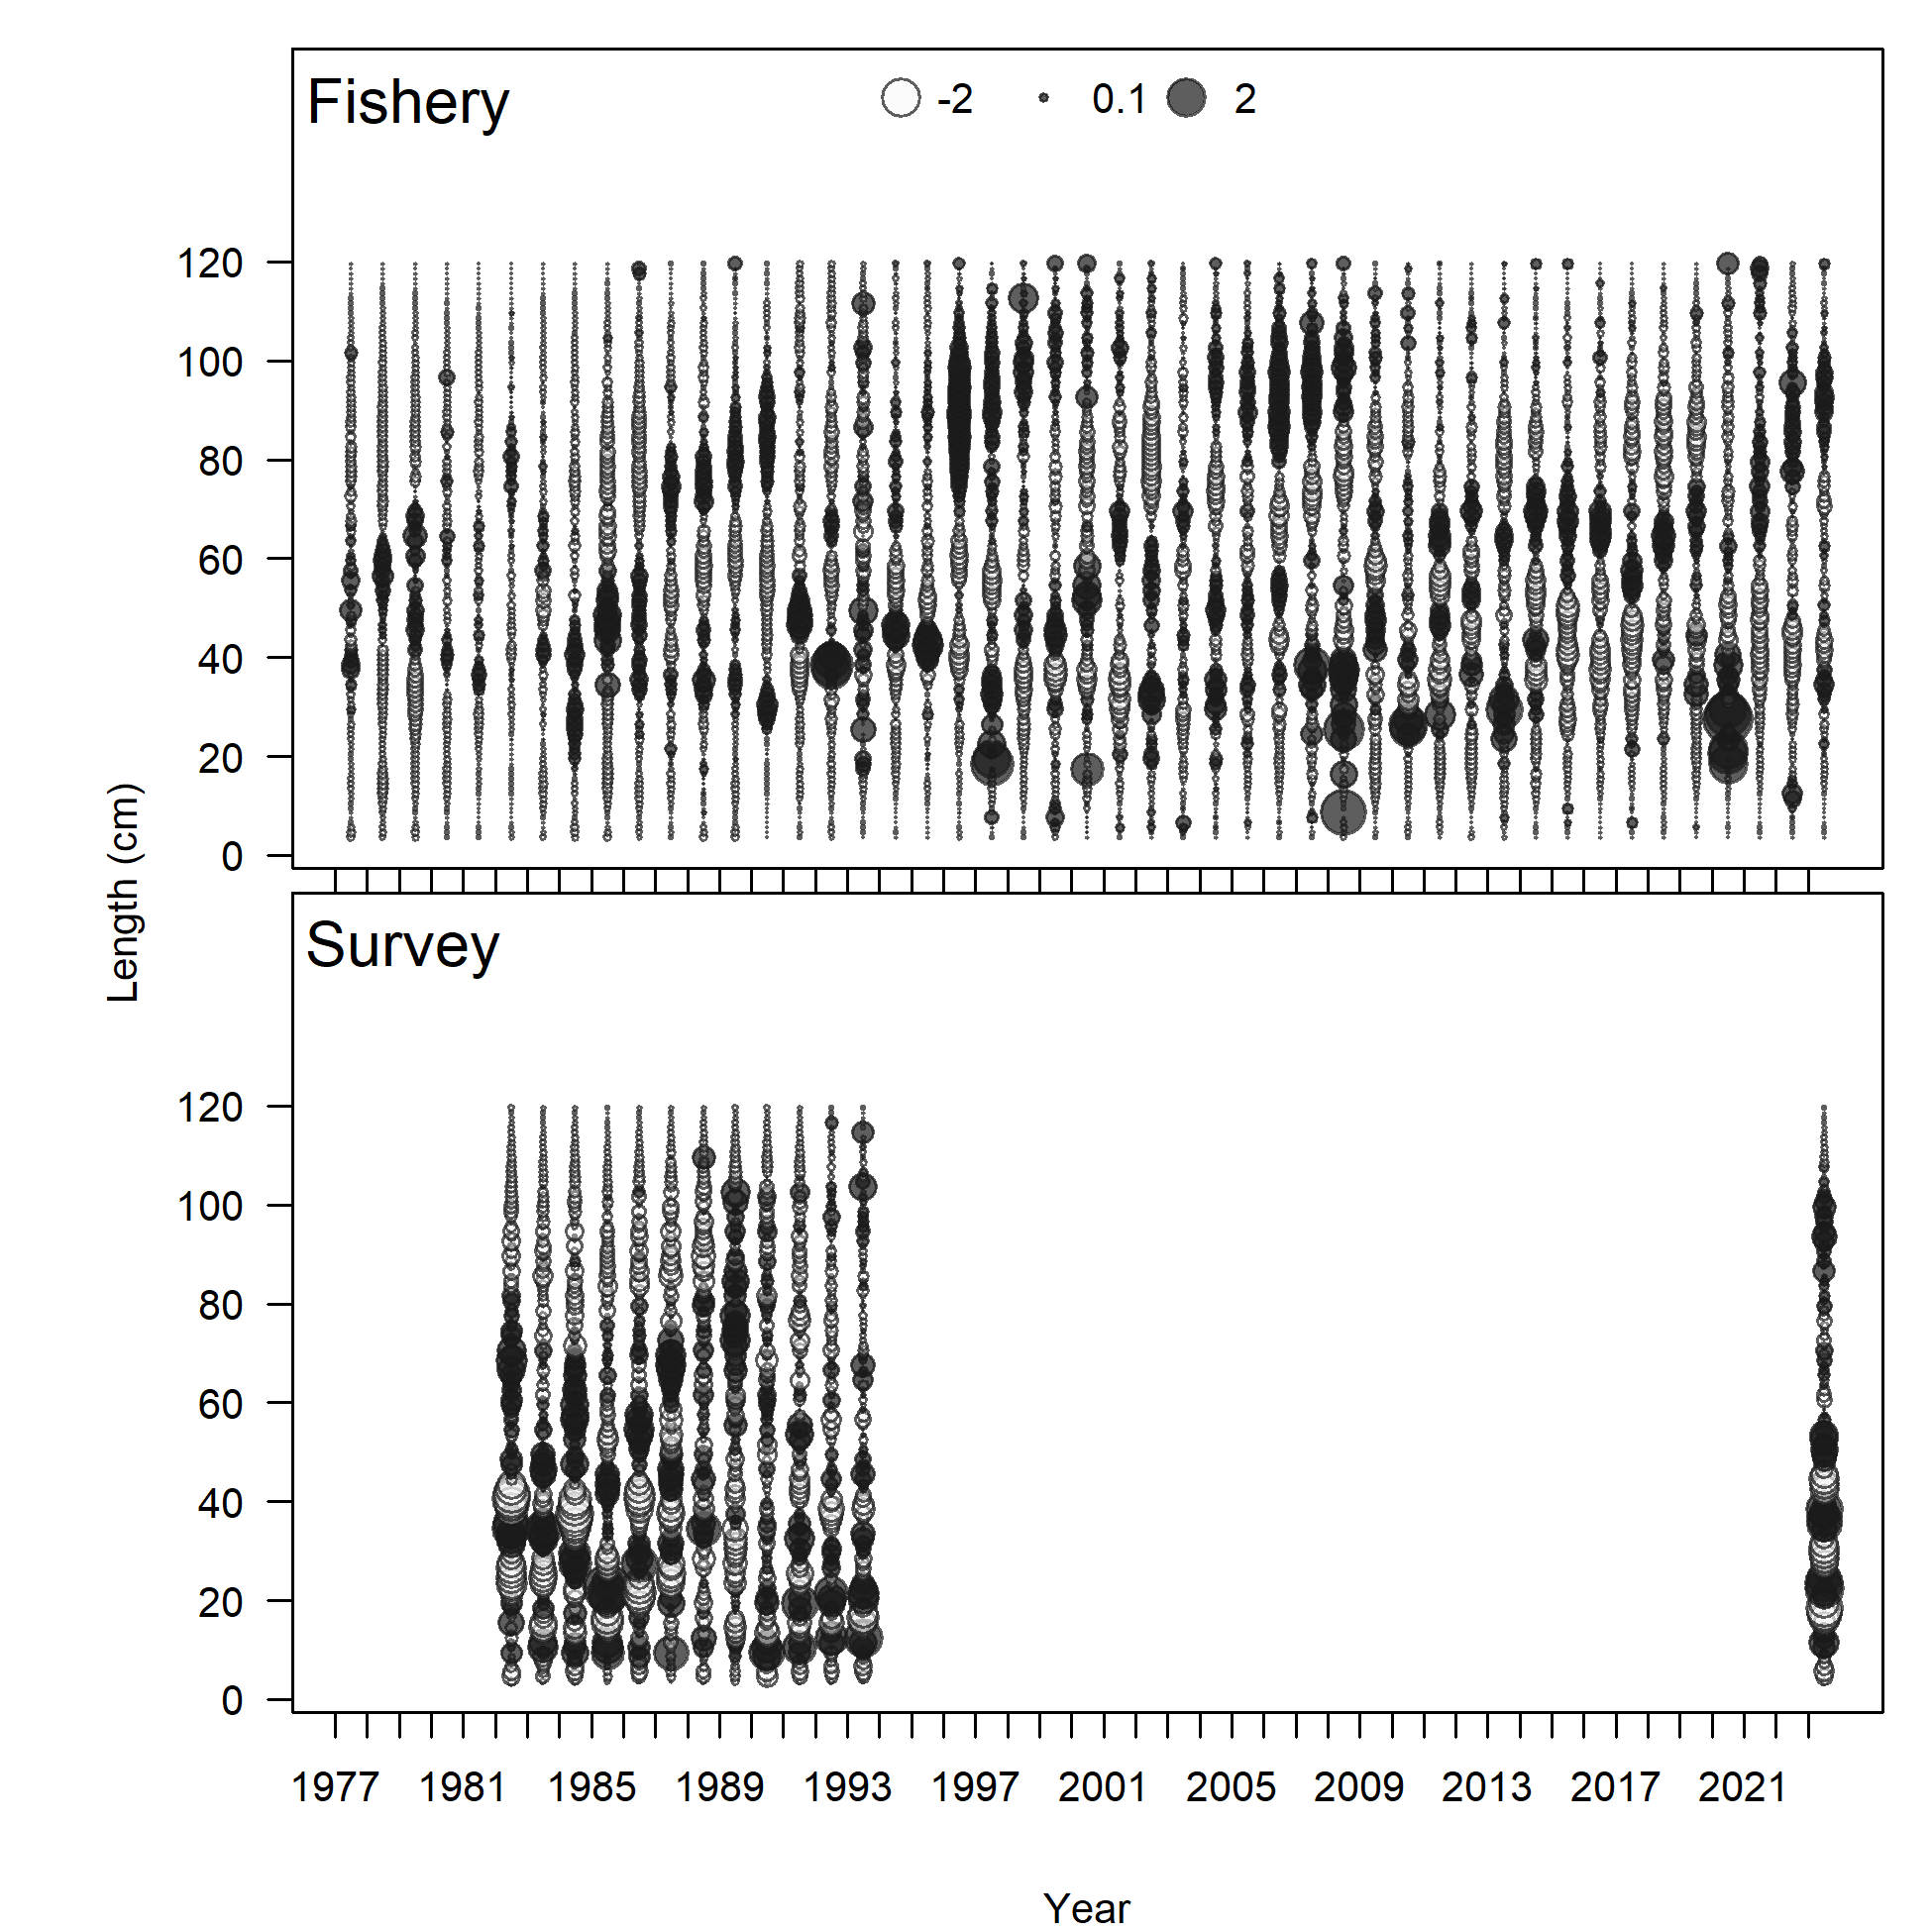
Pearson residuals, comparing across fleets
Closed bubbles are positive residuals (observed > expected) and open bubbles are negative residuals (observed < expected).
file: comp_lenfit__multi-fleet_comparison.png
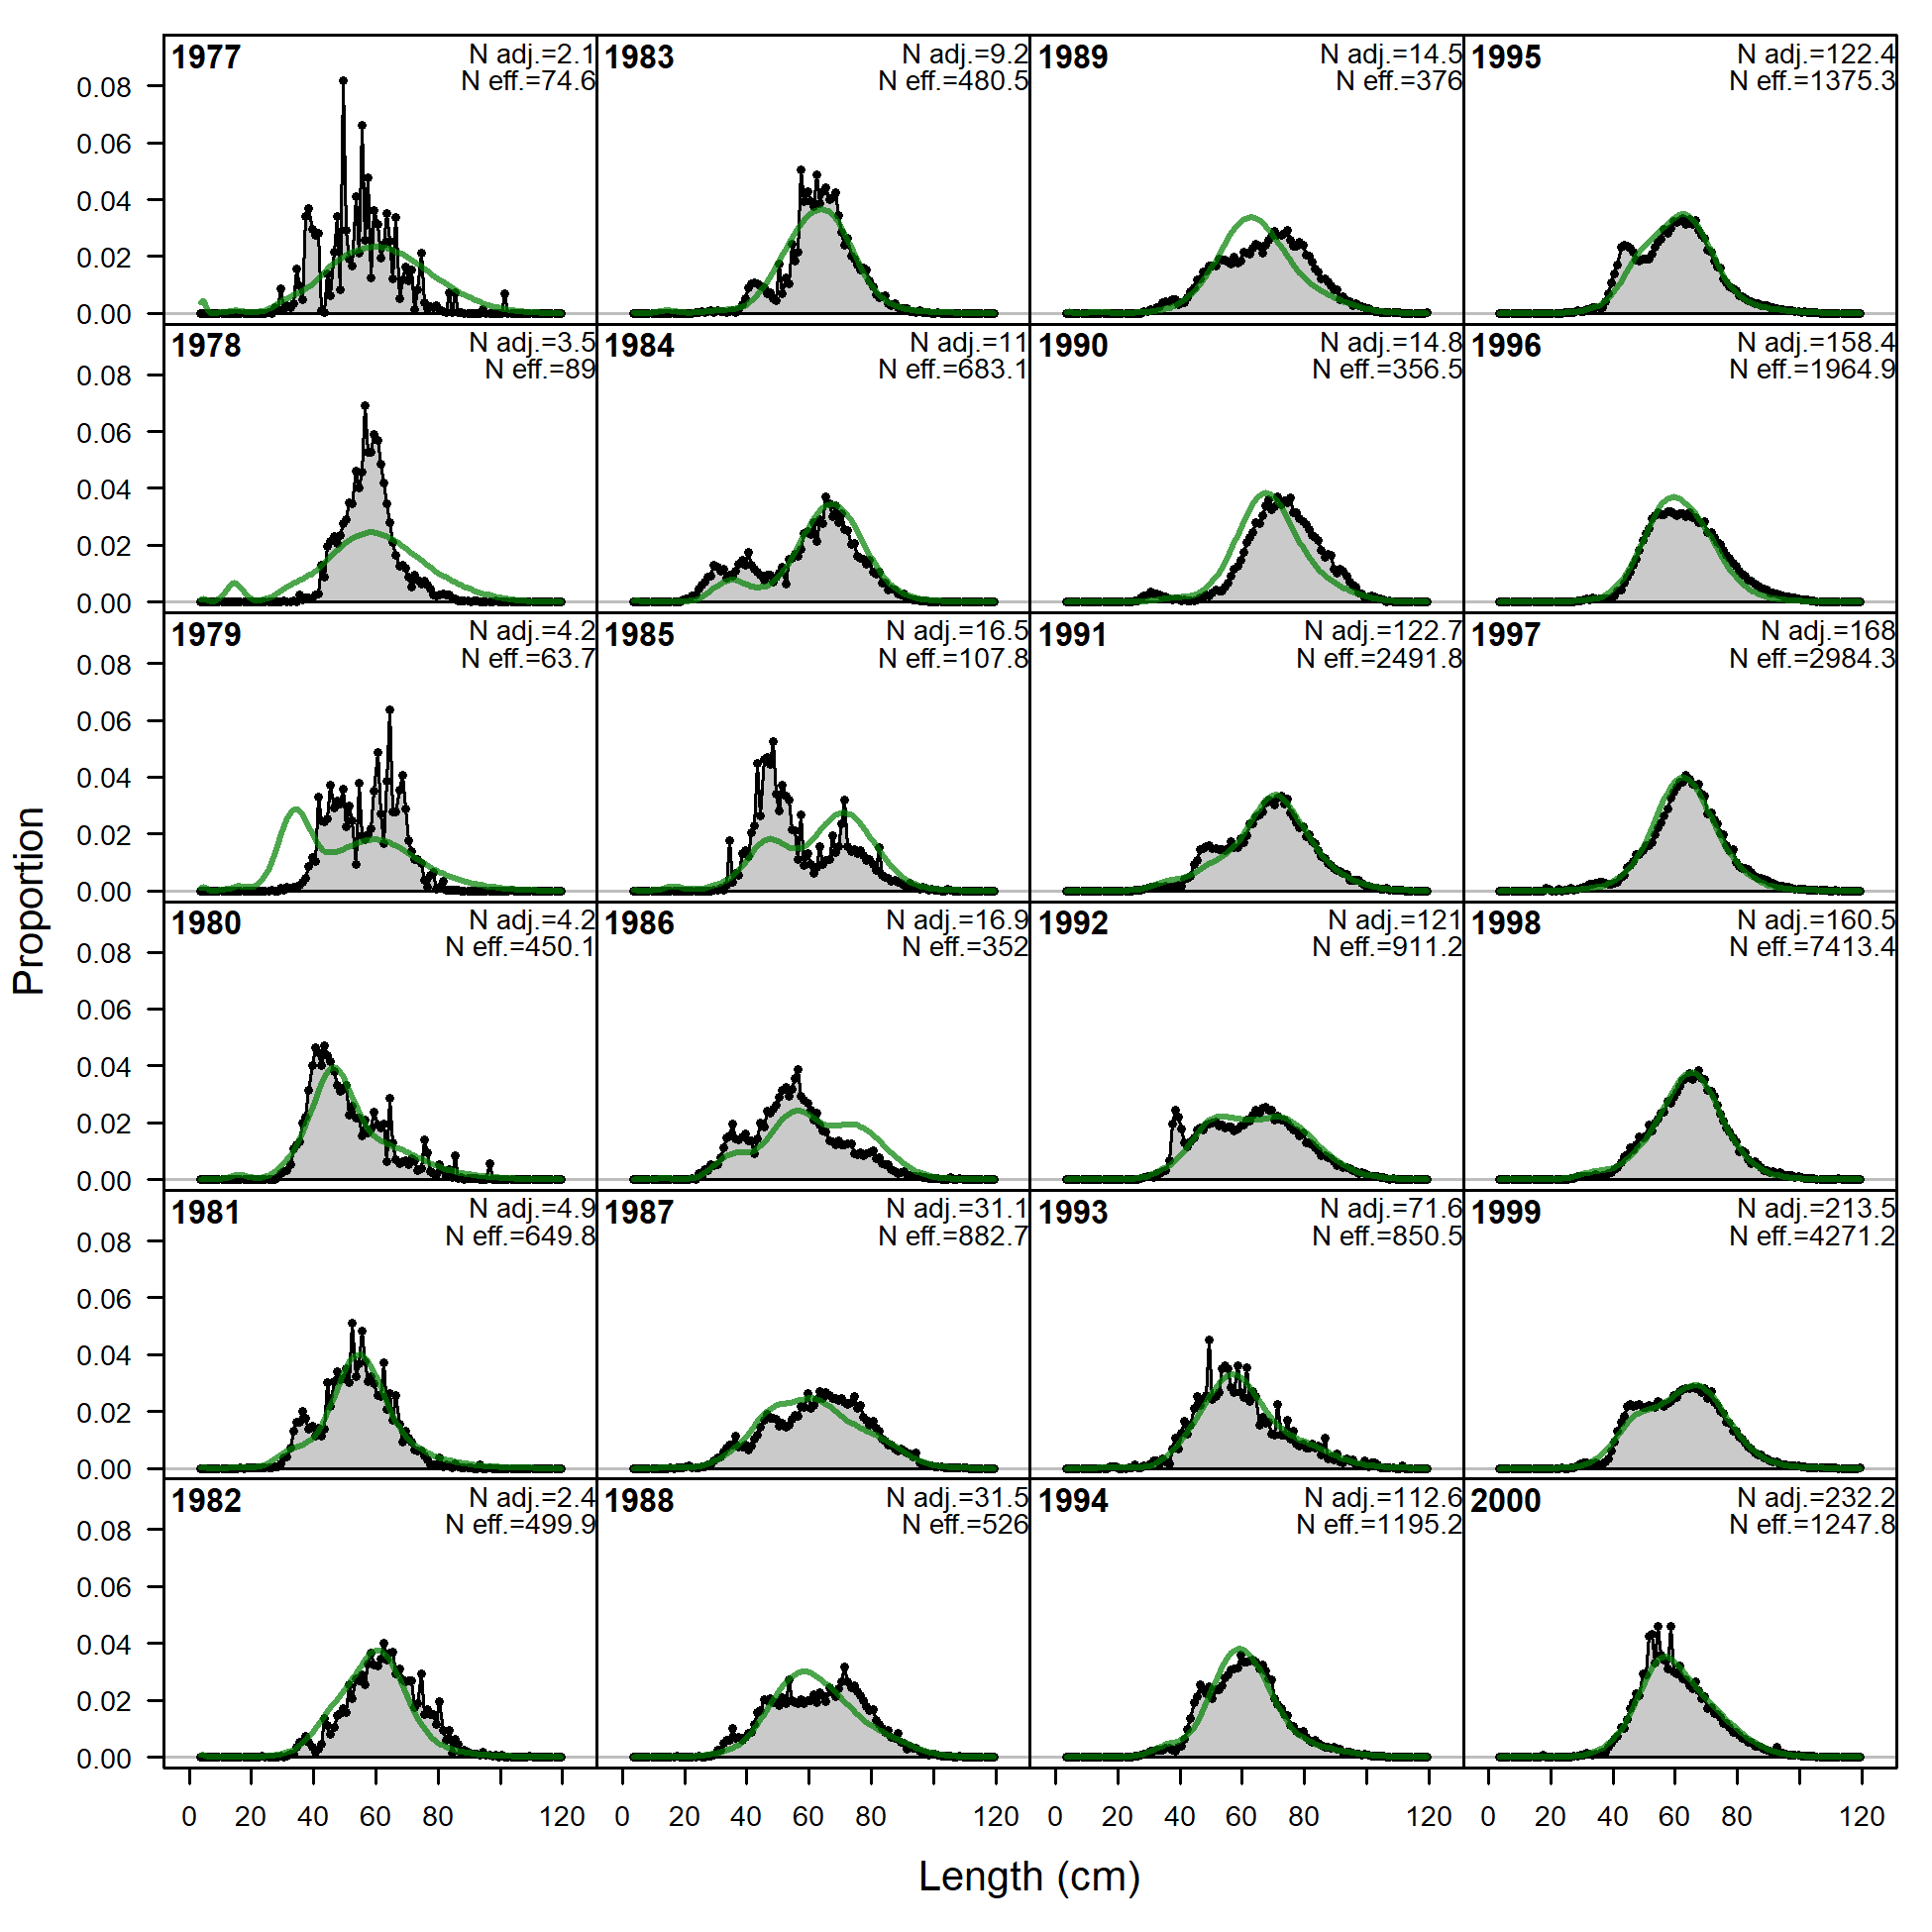
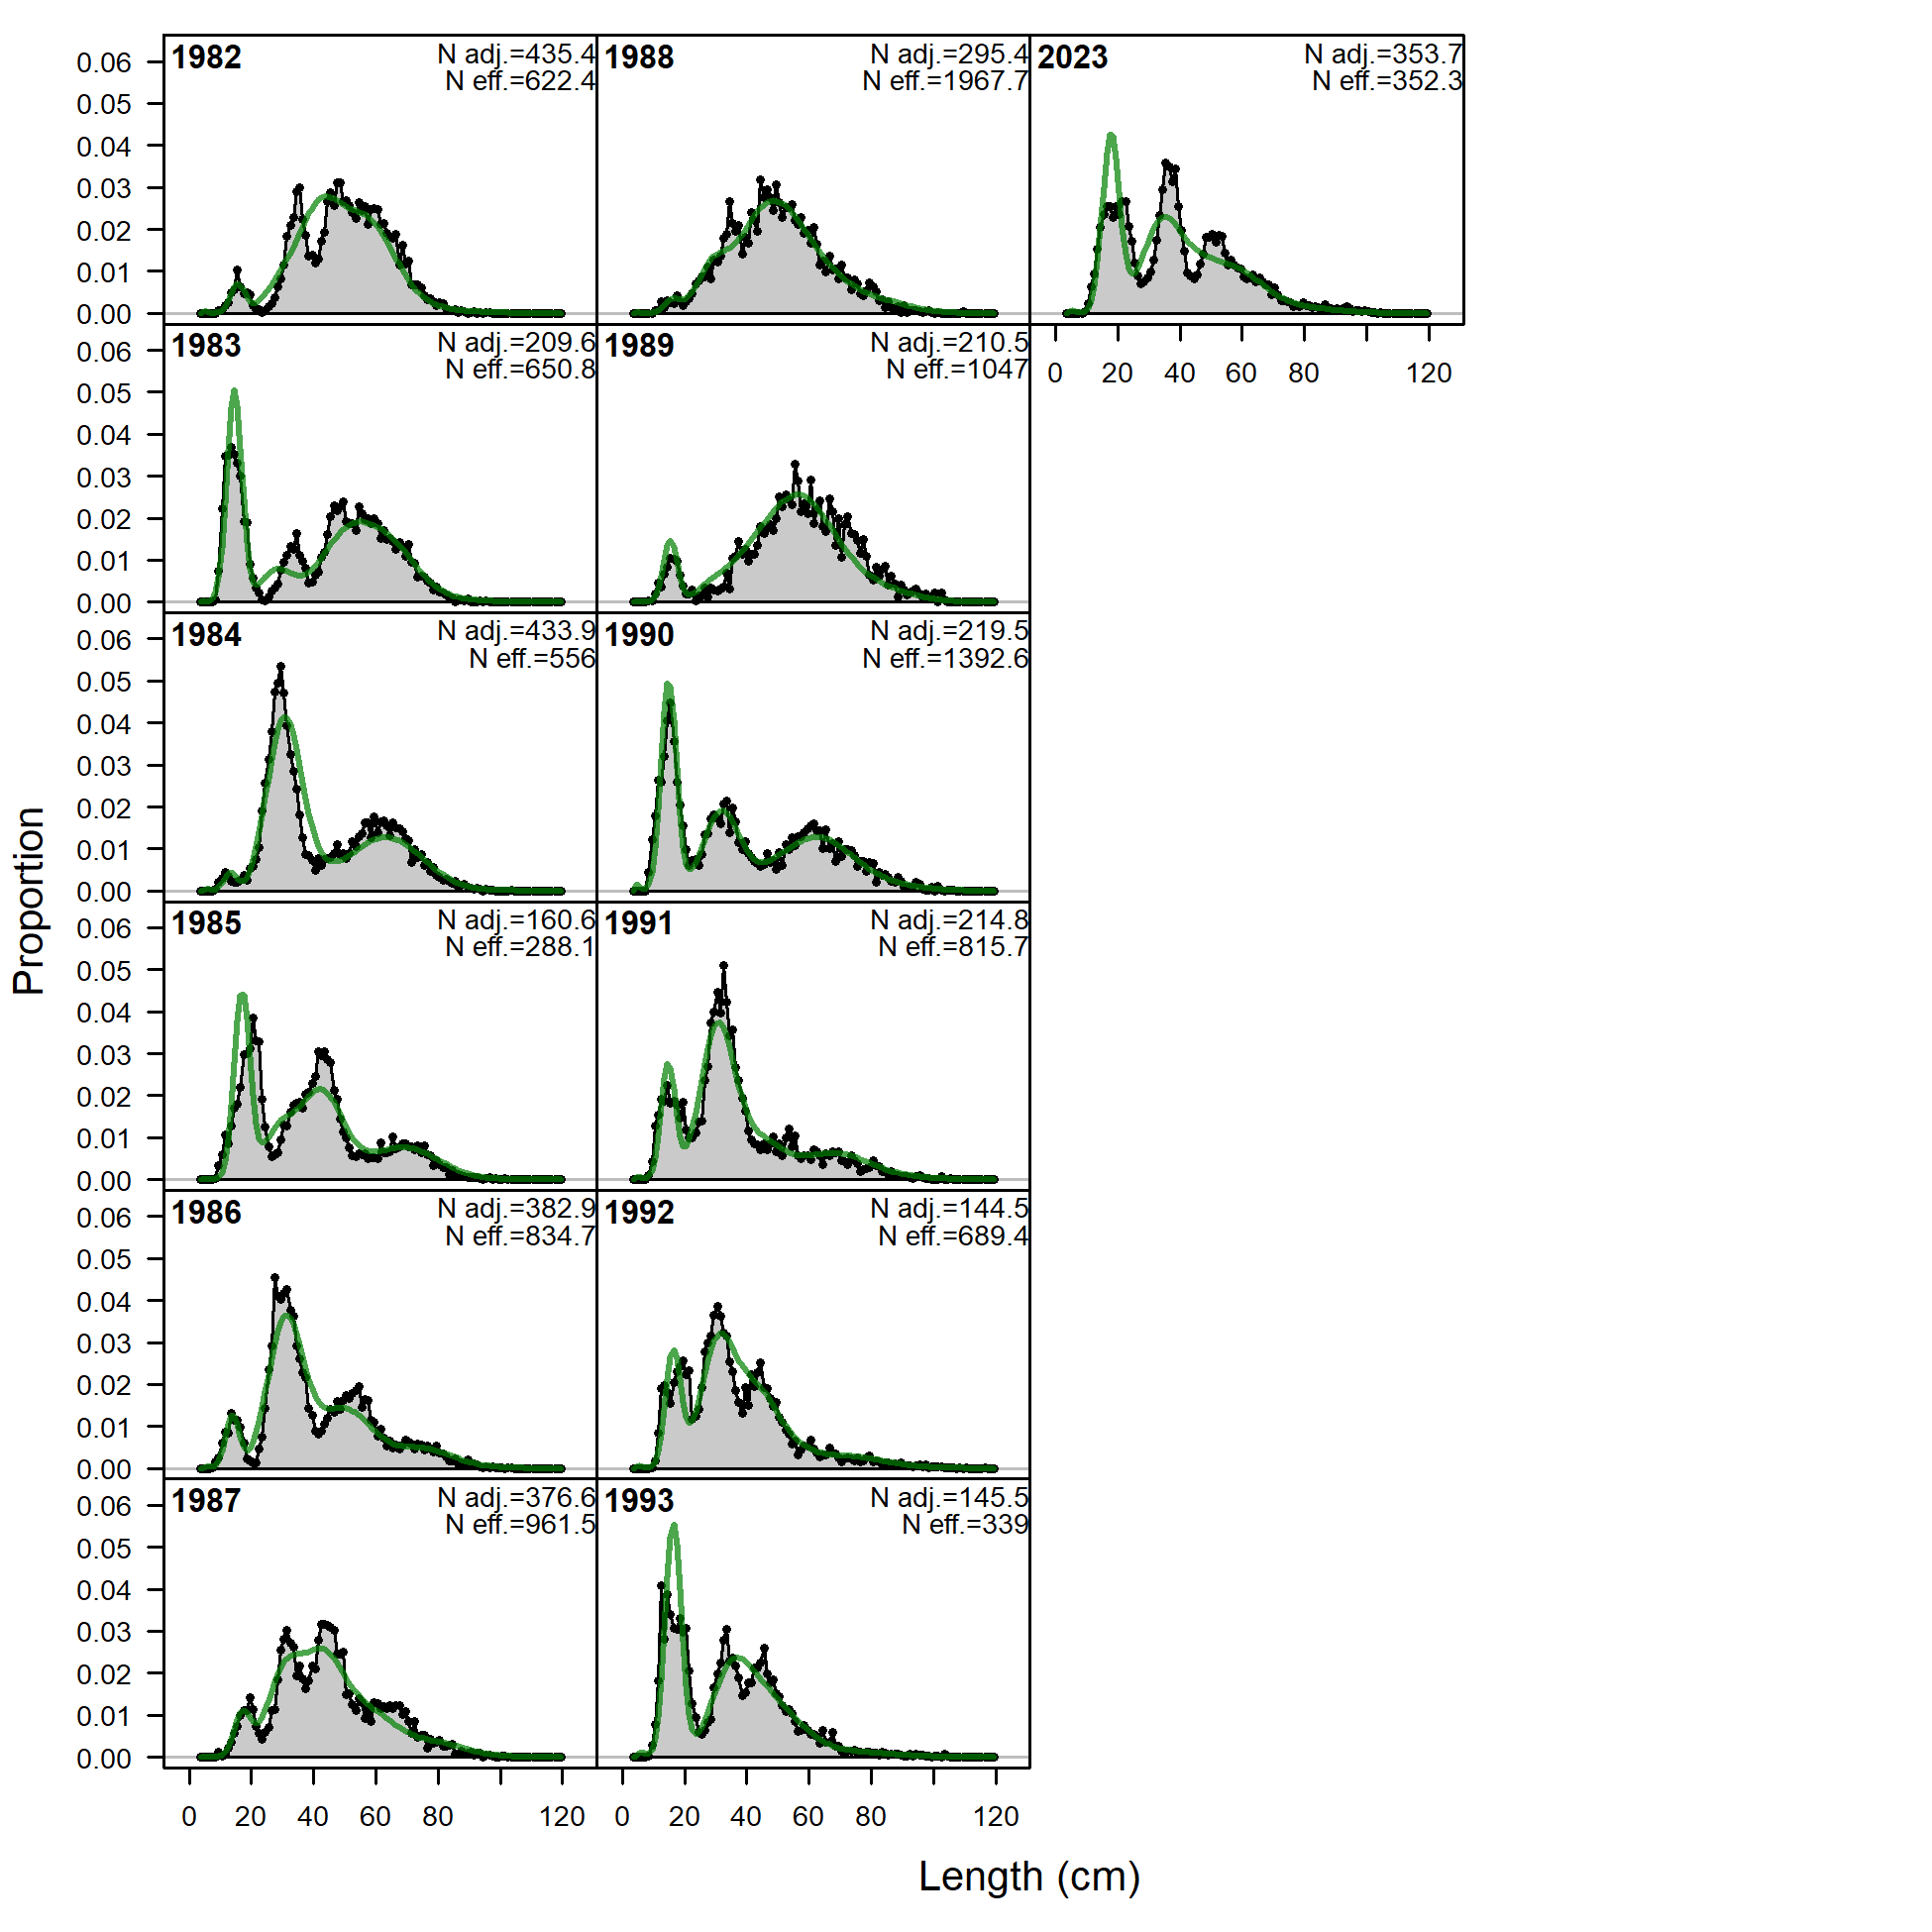
Length comps, whole catch, Fishery (plot 1 of 2).
'N adj.' is the input sample size after data-weighting adjustment. N eff. is the calculated effective sample size used in the McAllister-Ianelli tuning method.
file: comp_lenfit_flt1mkt0_page1.png
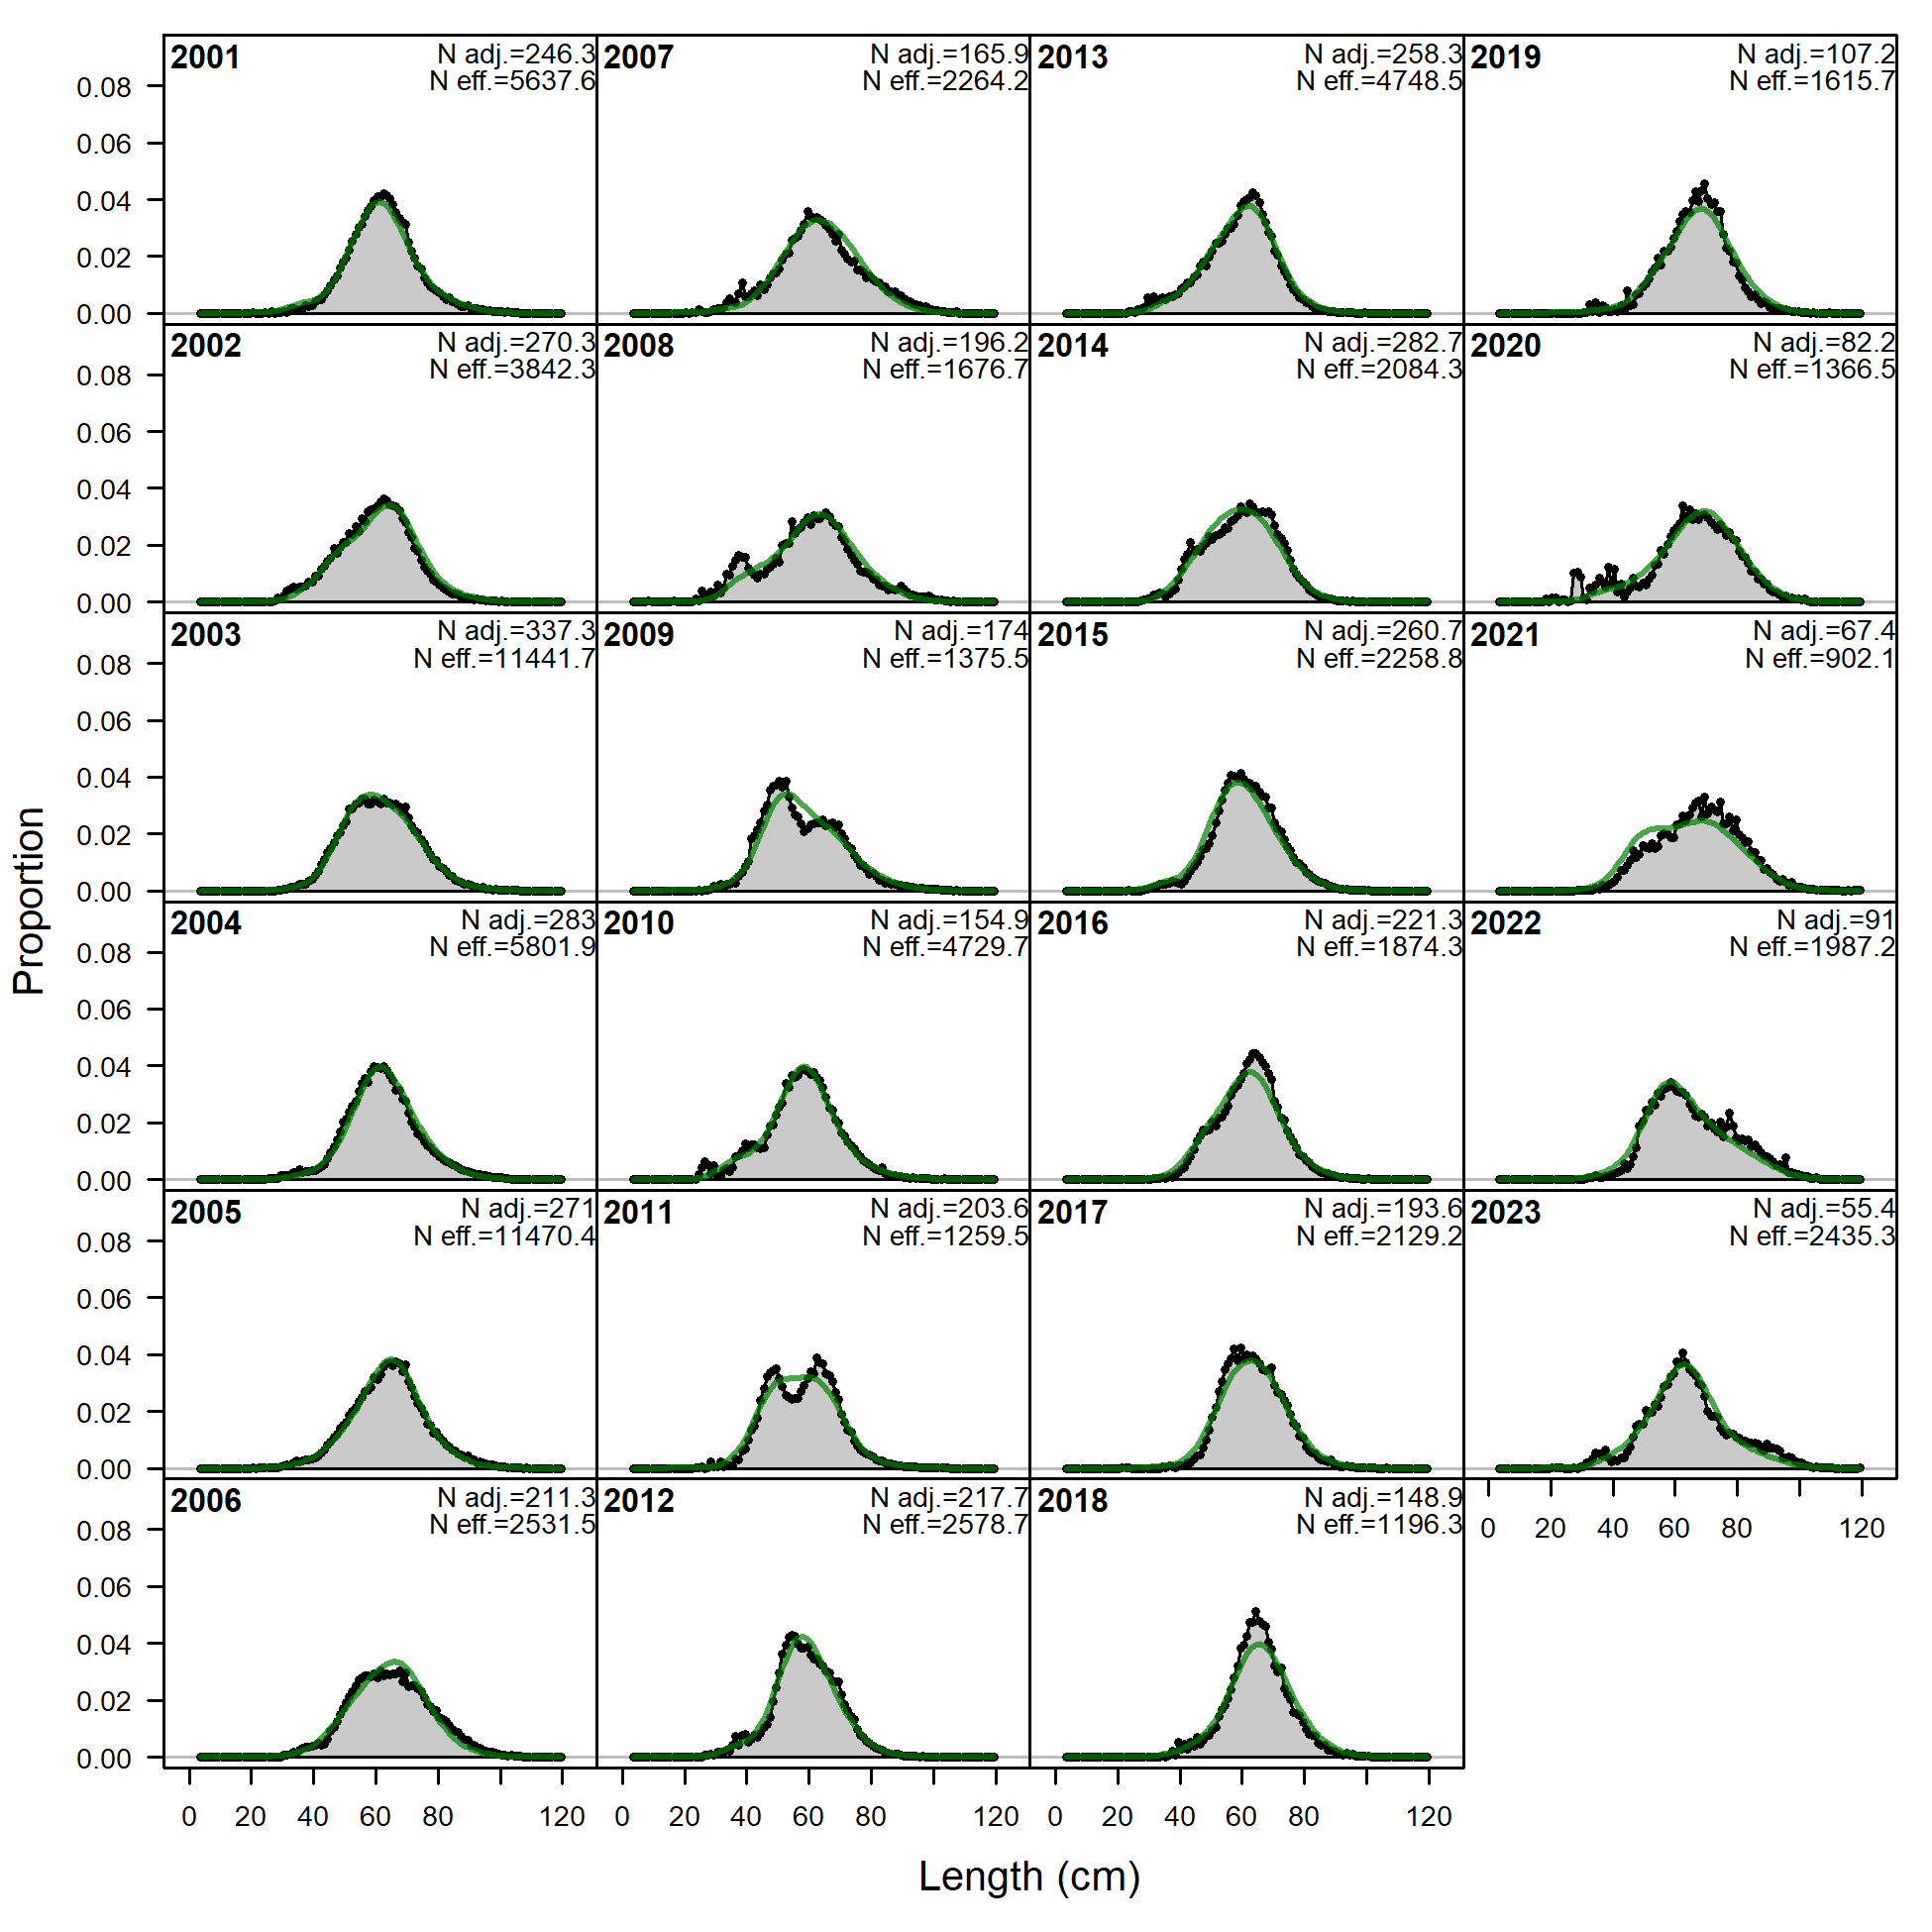
Length comps, whole catch, Fishery (plot 1 of 2).
'N adj.' is the input sample size after data-weighting adjustment. N eff. is the calculated effective sample size used in the McAllister-Ianelli tuning method. (plot 2 of 2)
file: comp_lenfit_flt1mkt0_page2.png
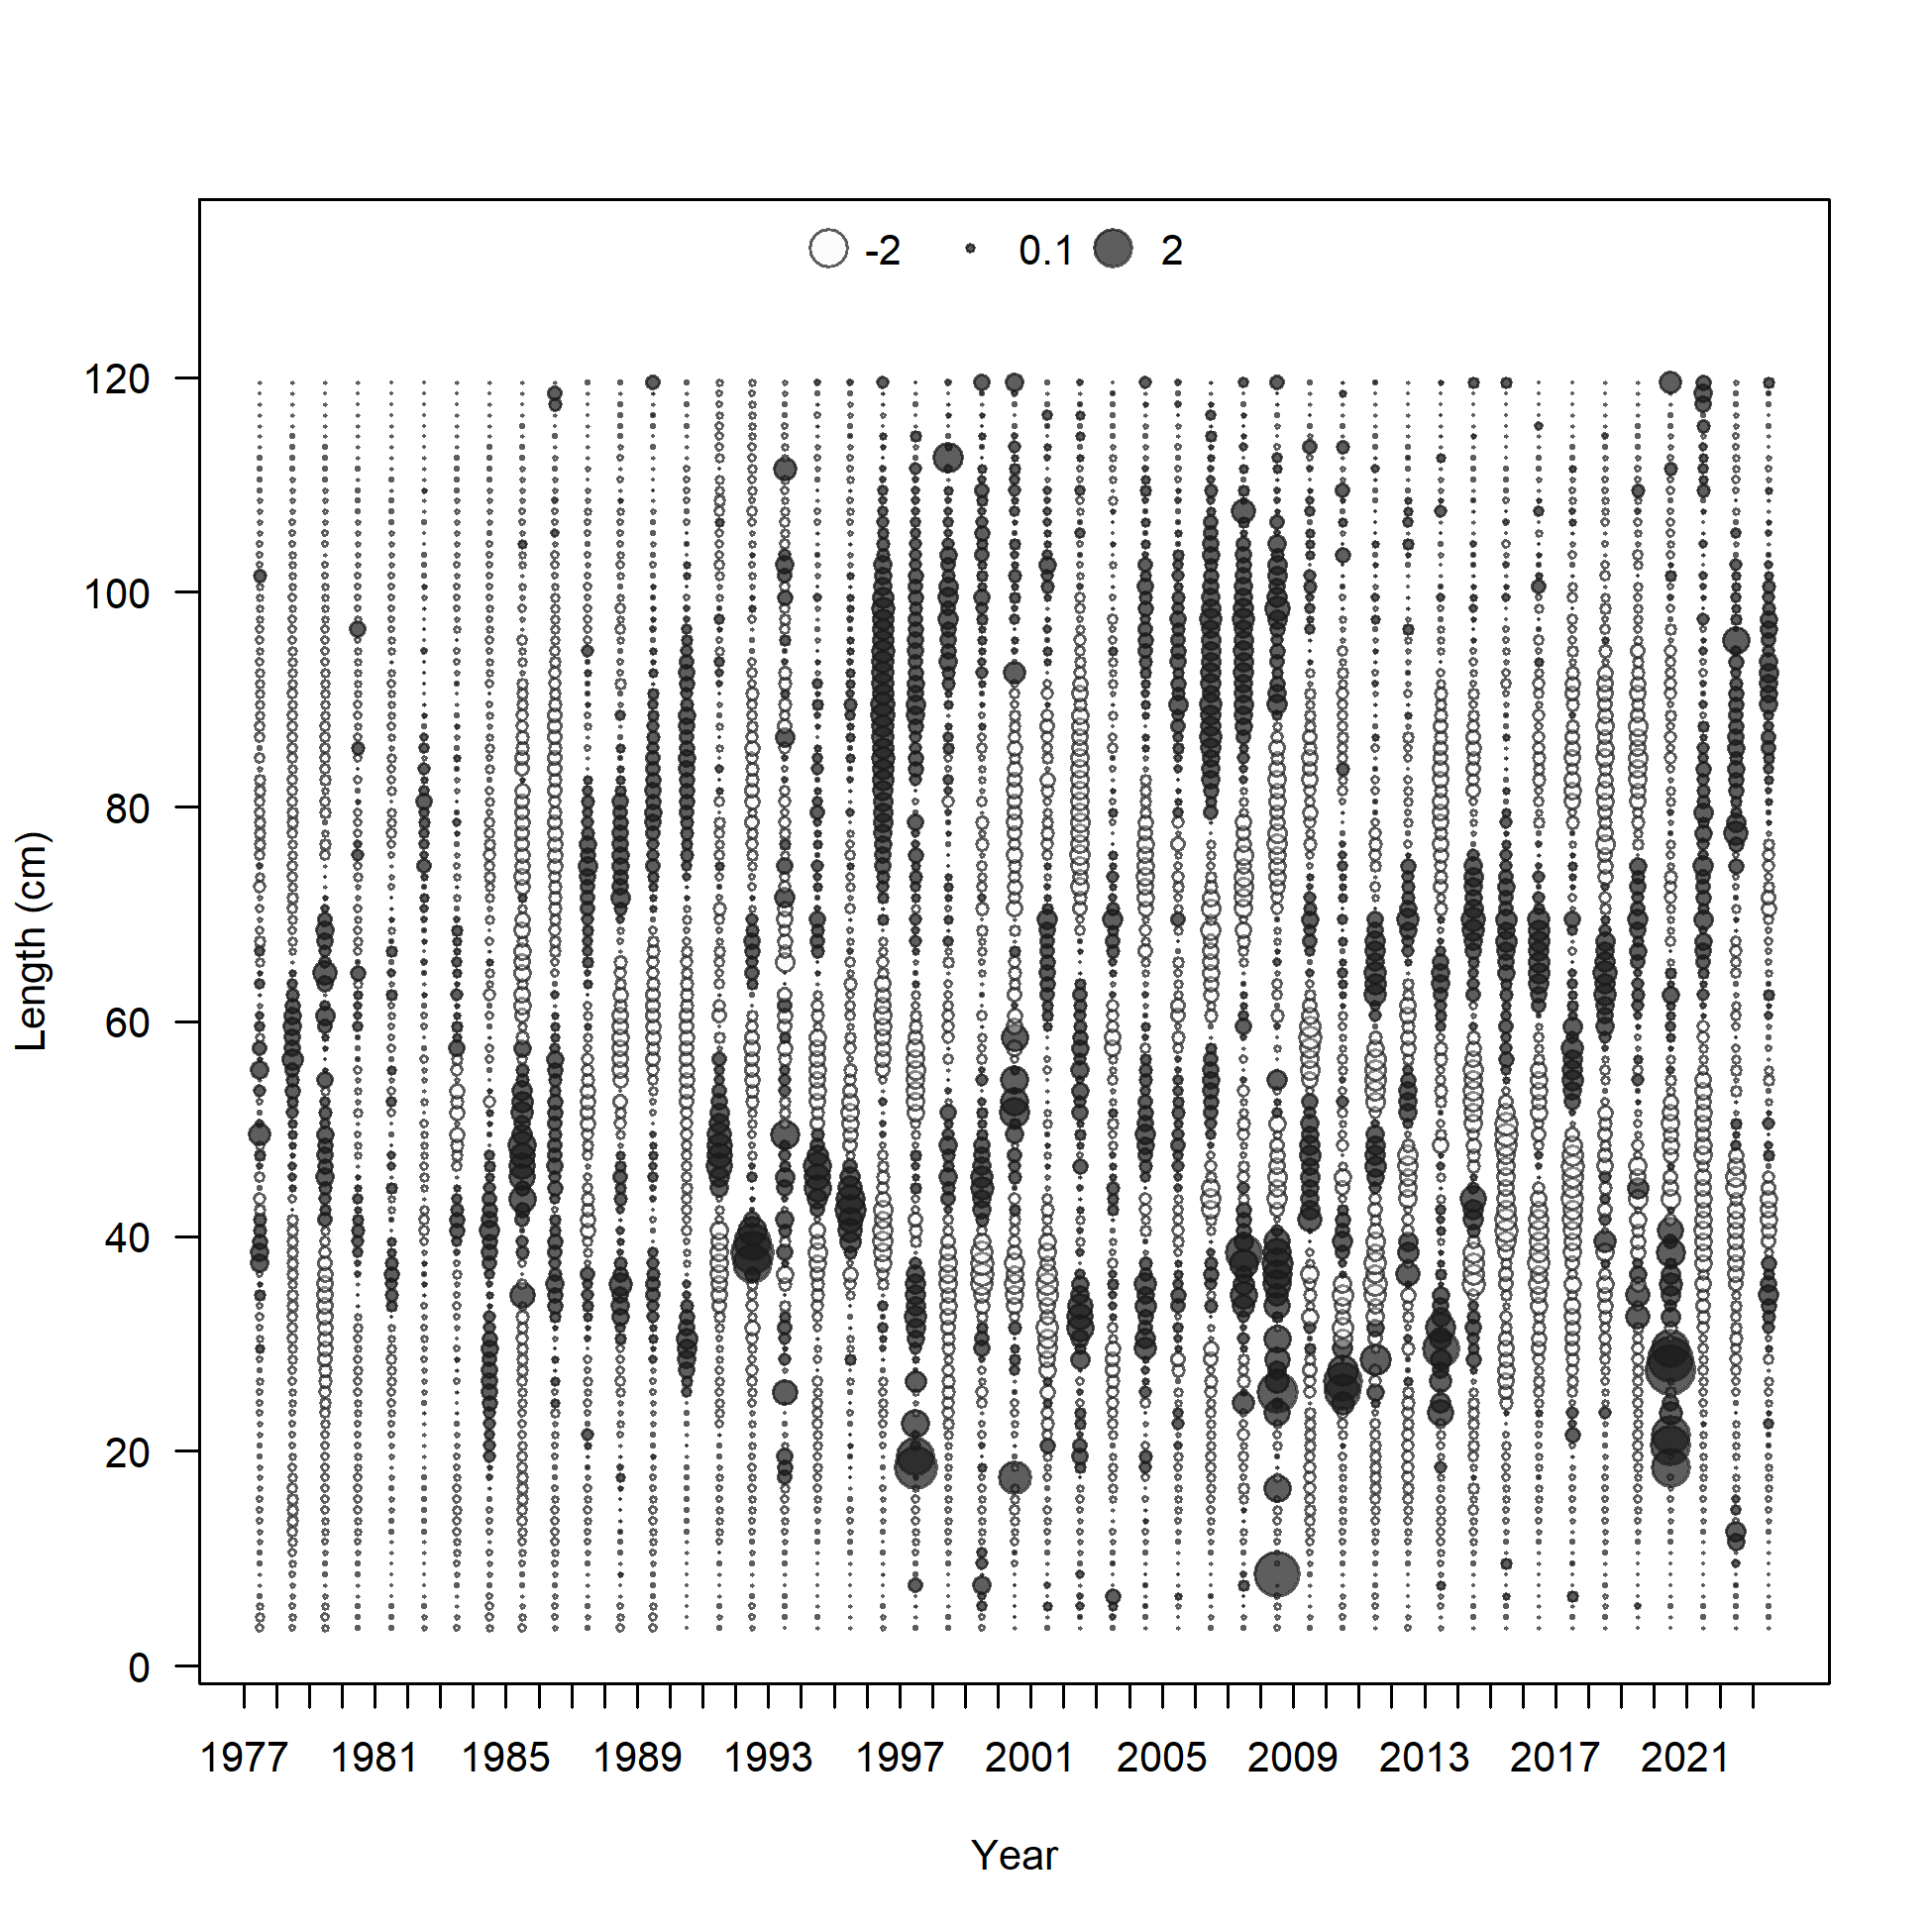
Pearson residuals, whole catch, Fishery (max=3.27) (plot 2 of 2)
Closed bubbles are positive residuals (observed > expected) and open bubbles are negative residuals (observed < expected).
file: comp_lenfit_residsflt1mkt0_page2.png
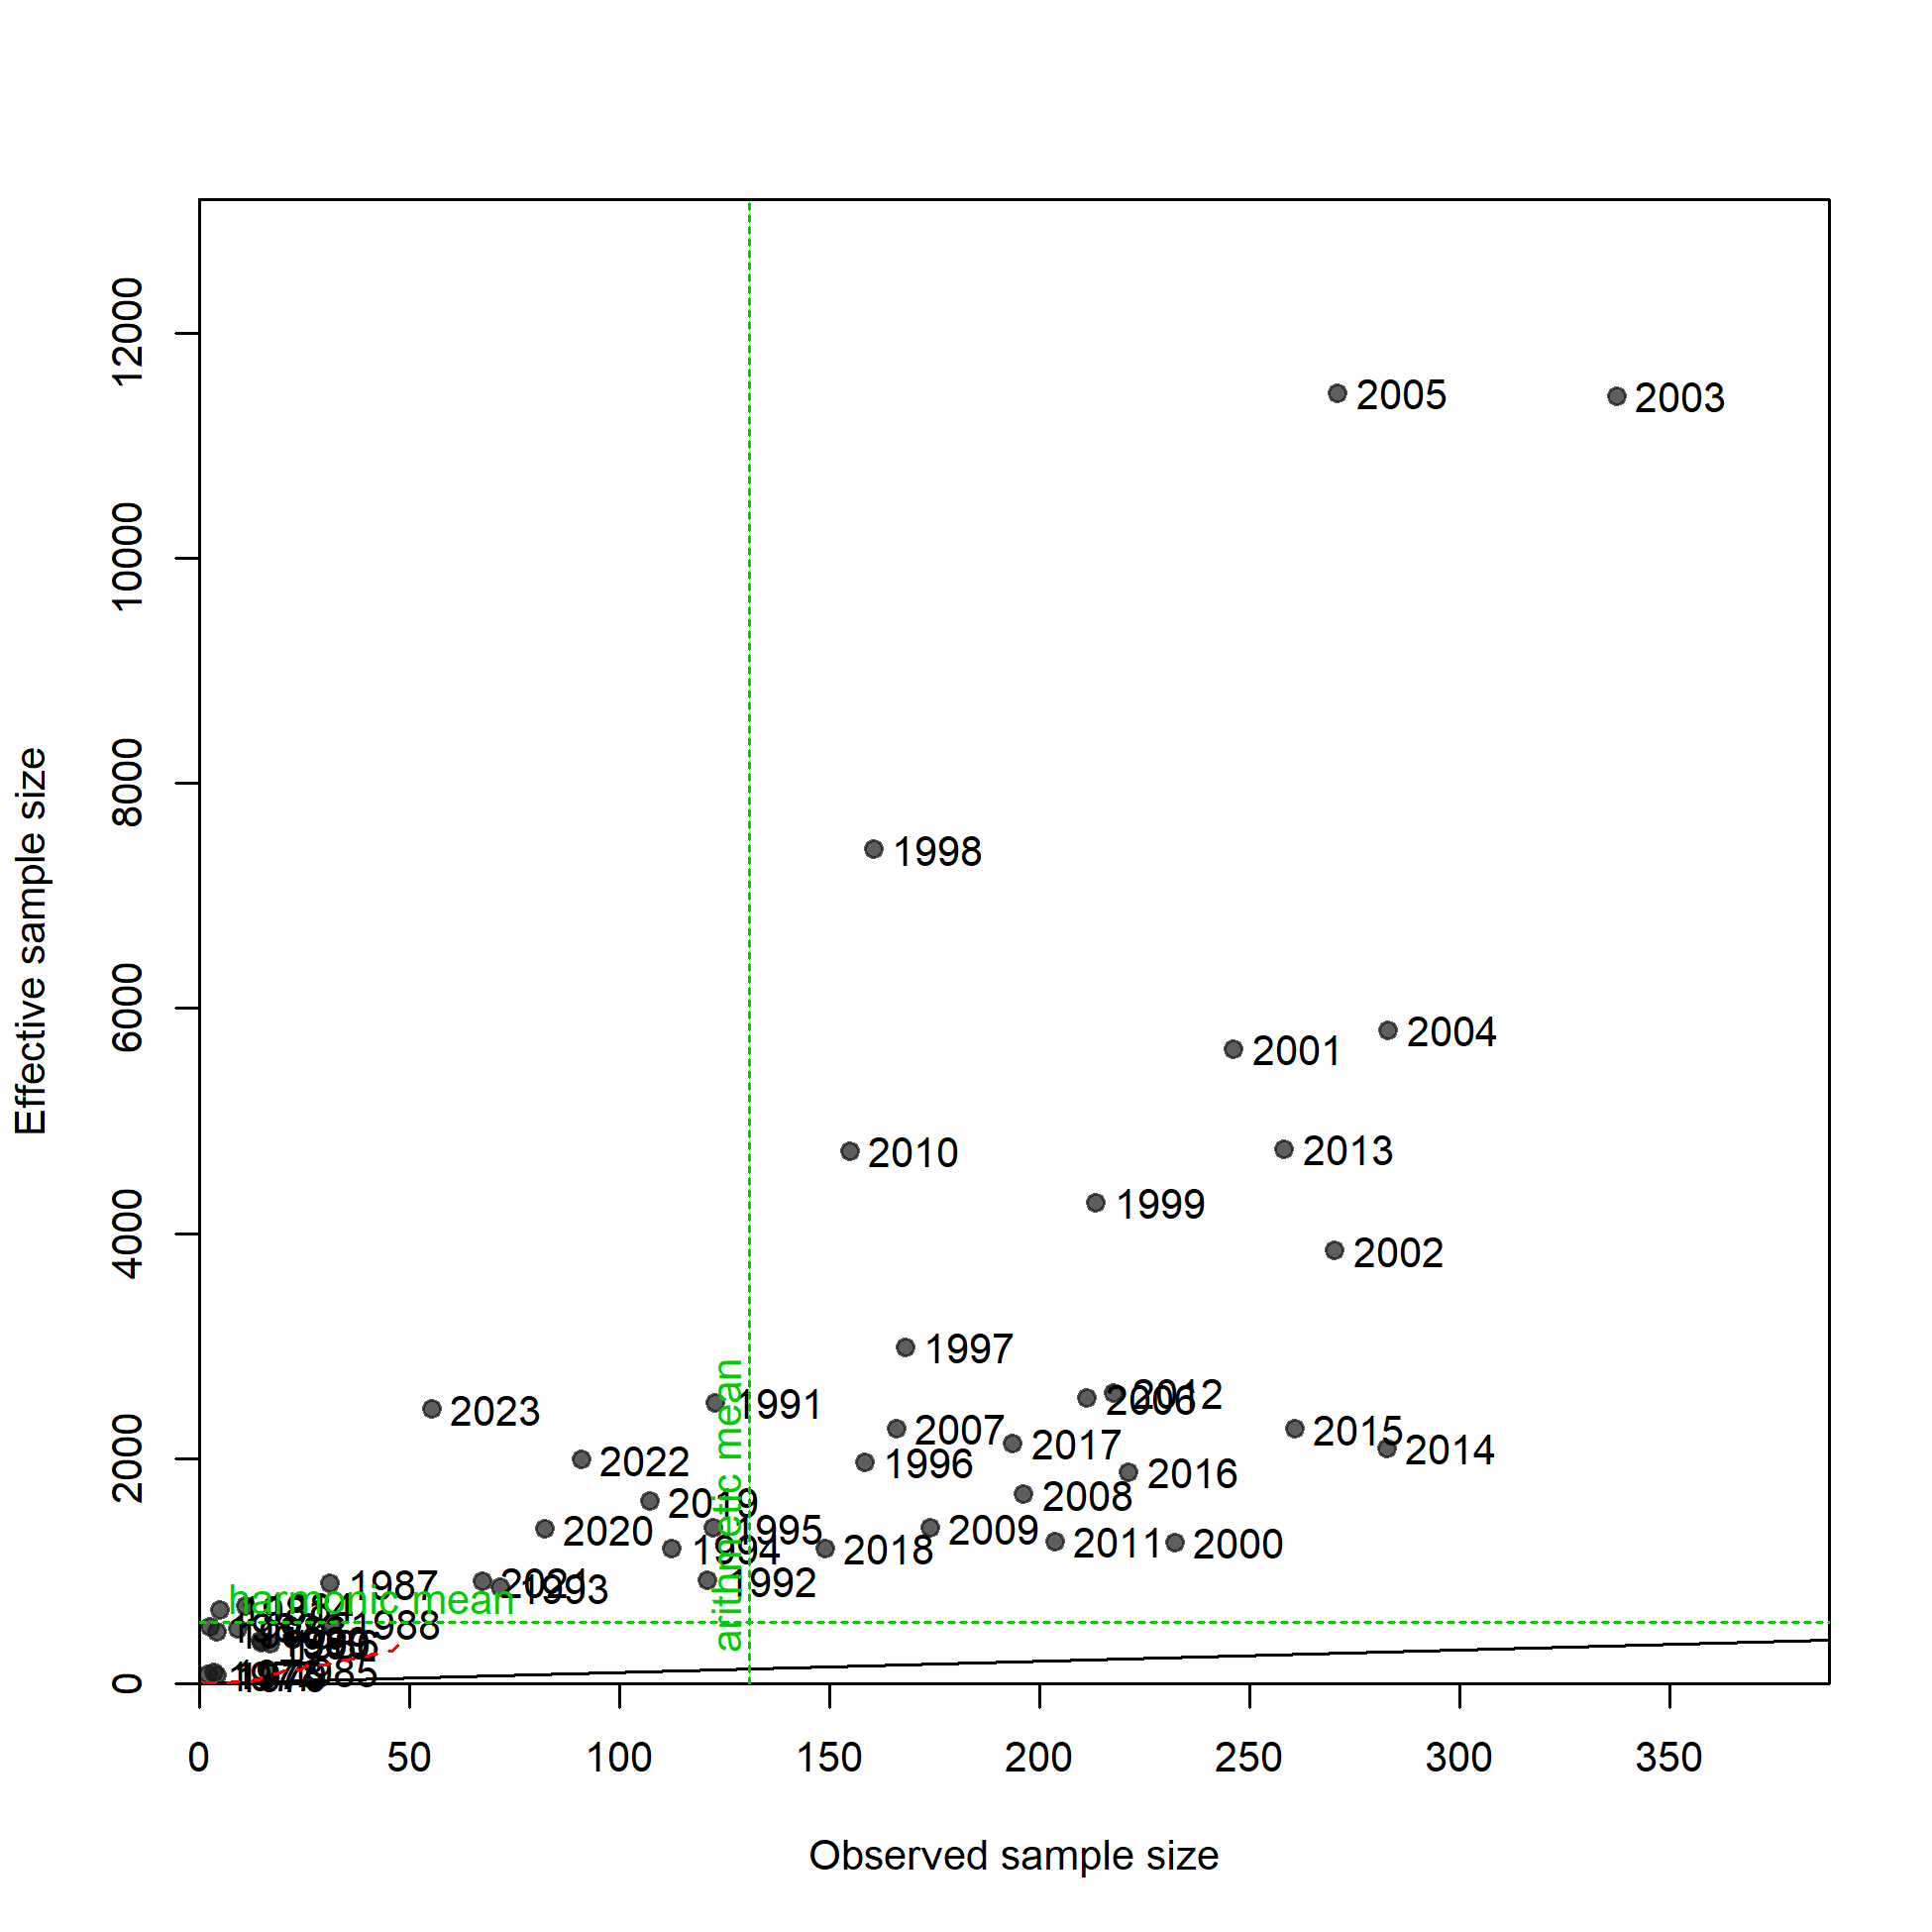
N-EffN comparison, Length comps, whole catch, Fishery
file: comp_lenfit_sampsize_flt1mkt0.png
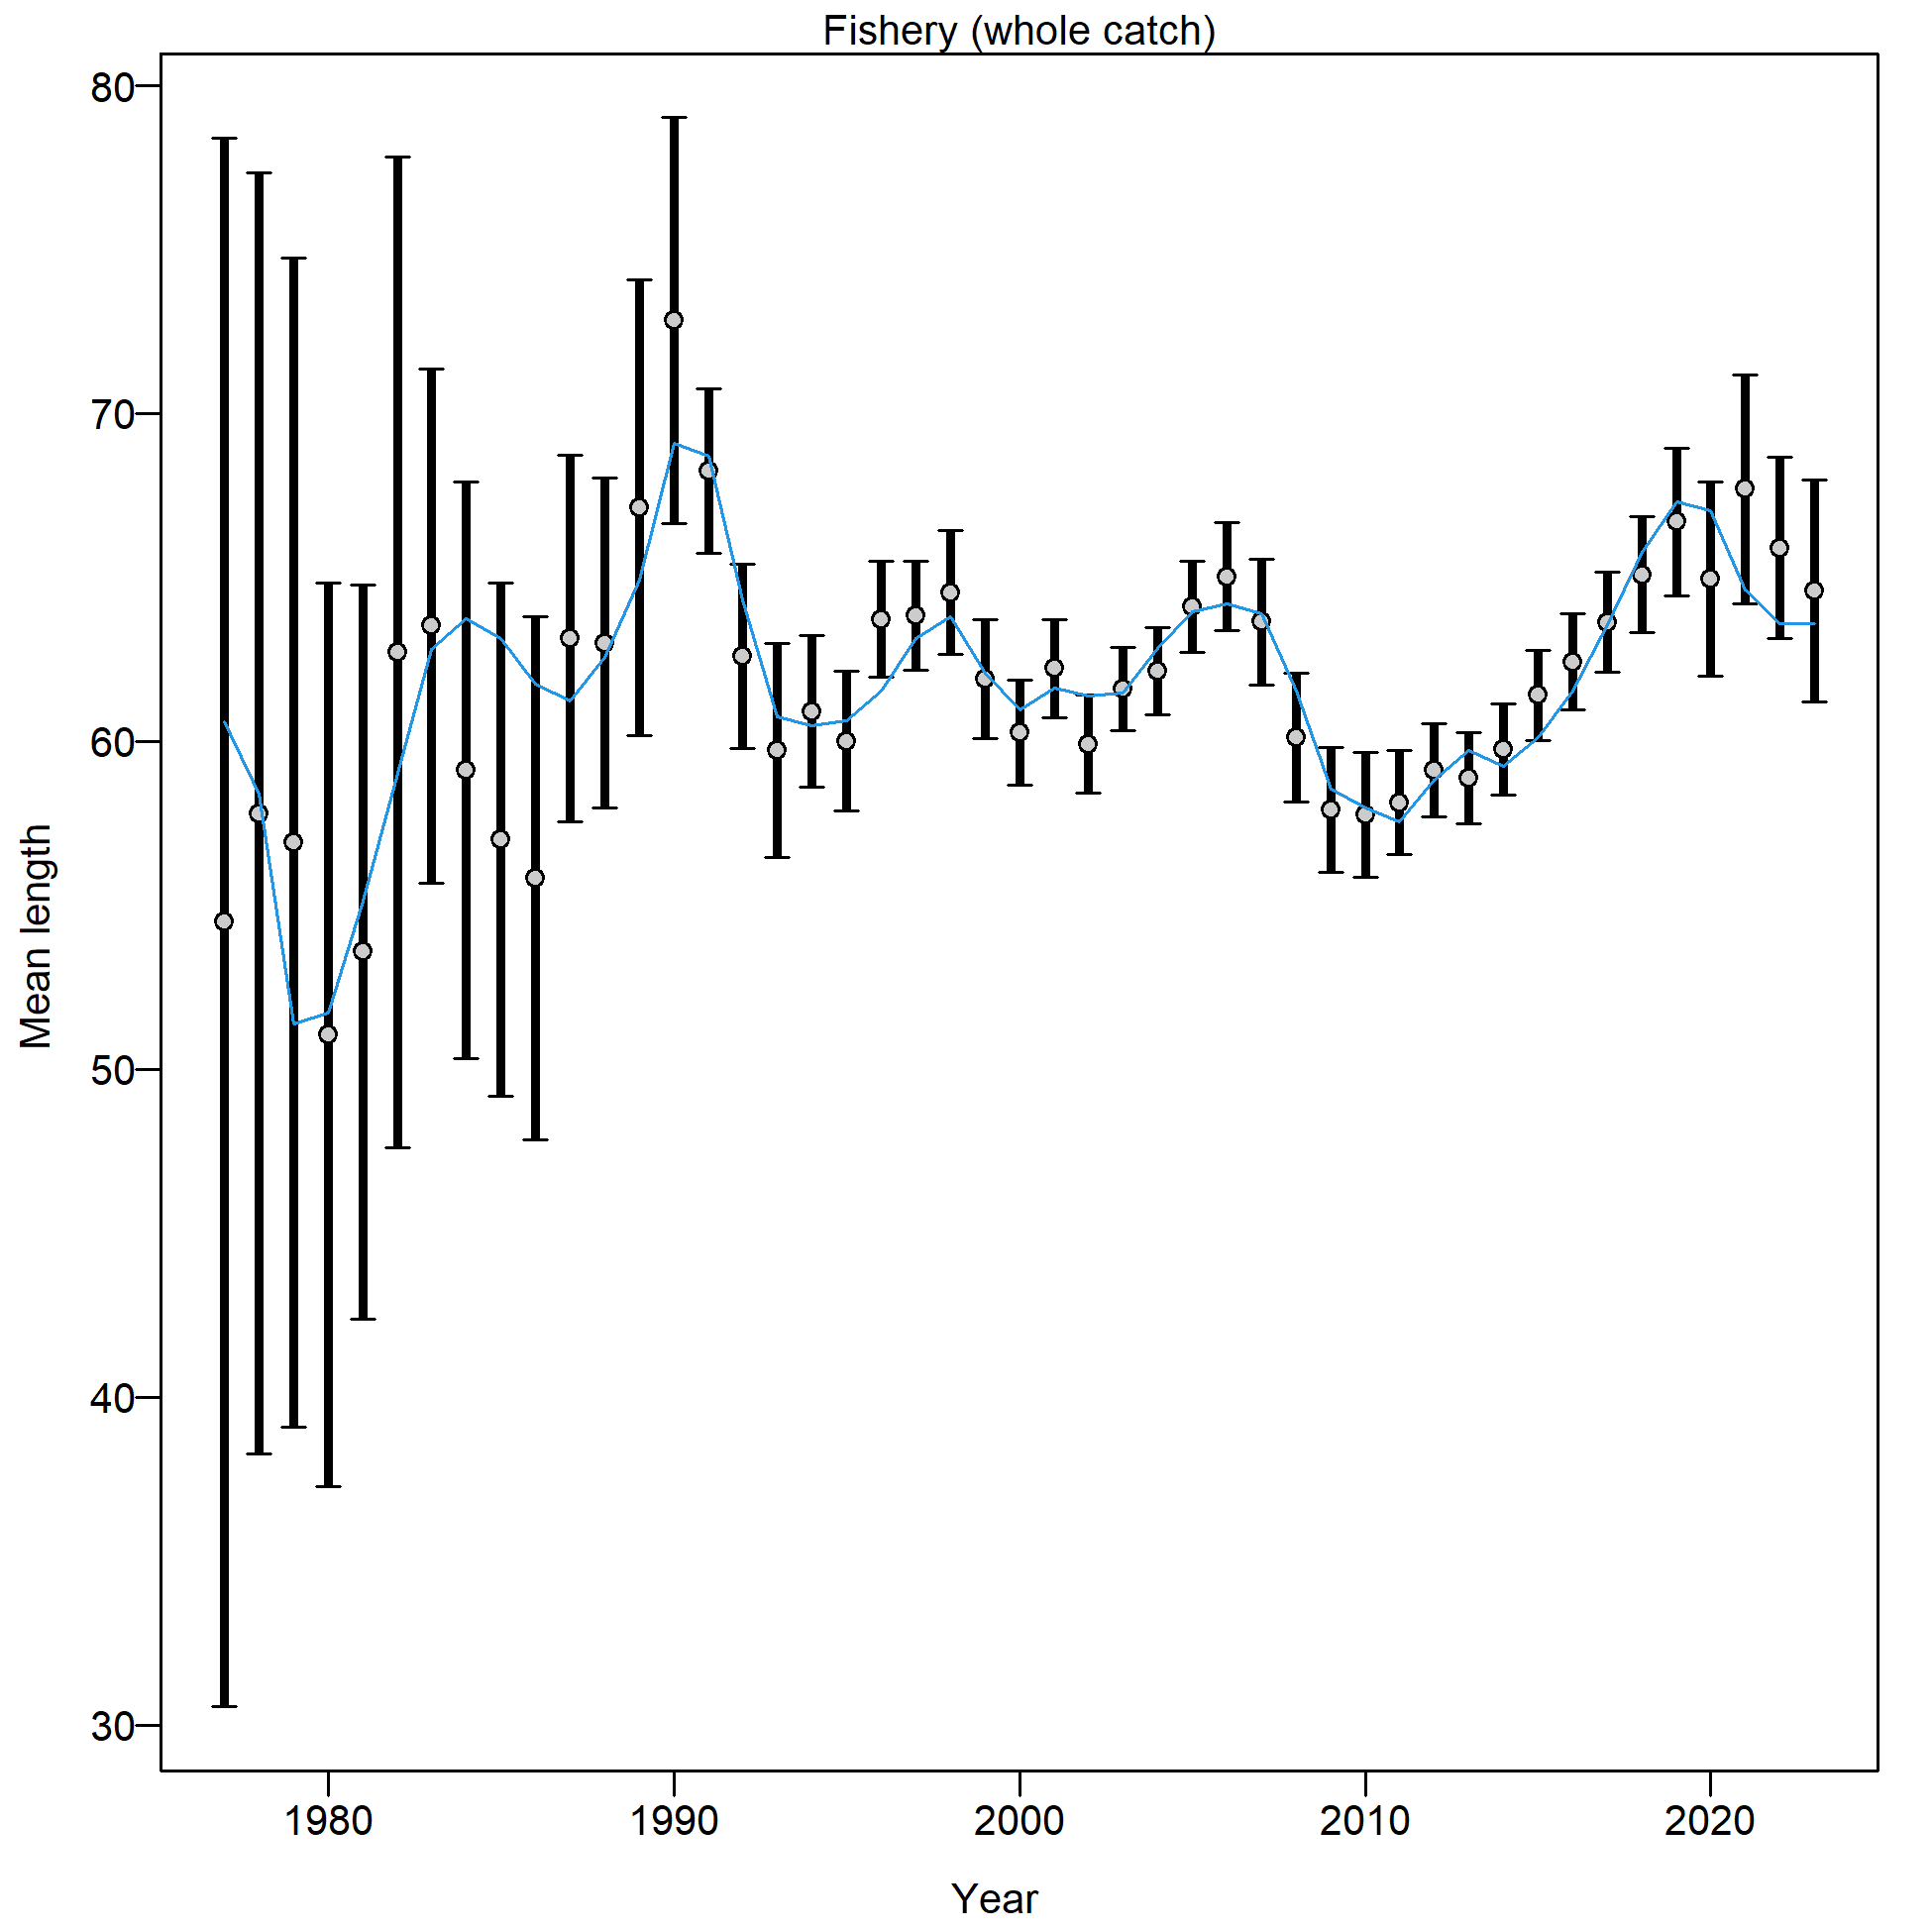
WARNING: this figure is based on multinomial likelihood and has not been updated to account for Dirichlet-Multinomial likelihood and the sample size adjustment associated with the estimated log(Θ) parameters.
Mean length for Fishery with 95% confidence intervals based on current samples sizes.
Francis data weighting method TA1.8: thinner intervals (with capped ends) show result of further adjusting sample sizes based on suggested multiplier (with 95% interval) for len data from Fishery:
1.0024 (0.7359-1.5447)
For more info, see
Francis, R.I.C.C. (2011). Data weighting in statistical fisheries stock assessment models. Can. J. Fish. Aquat. Sci. 68: 1124-1138. https://doi.org/10.1139/f2011-025
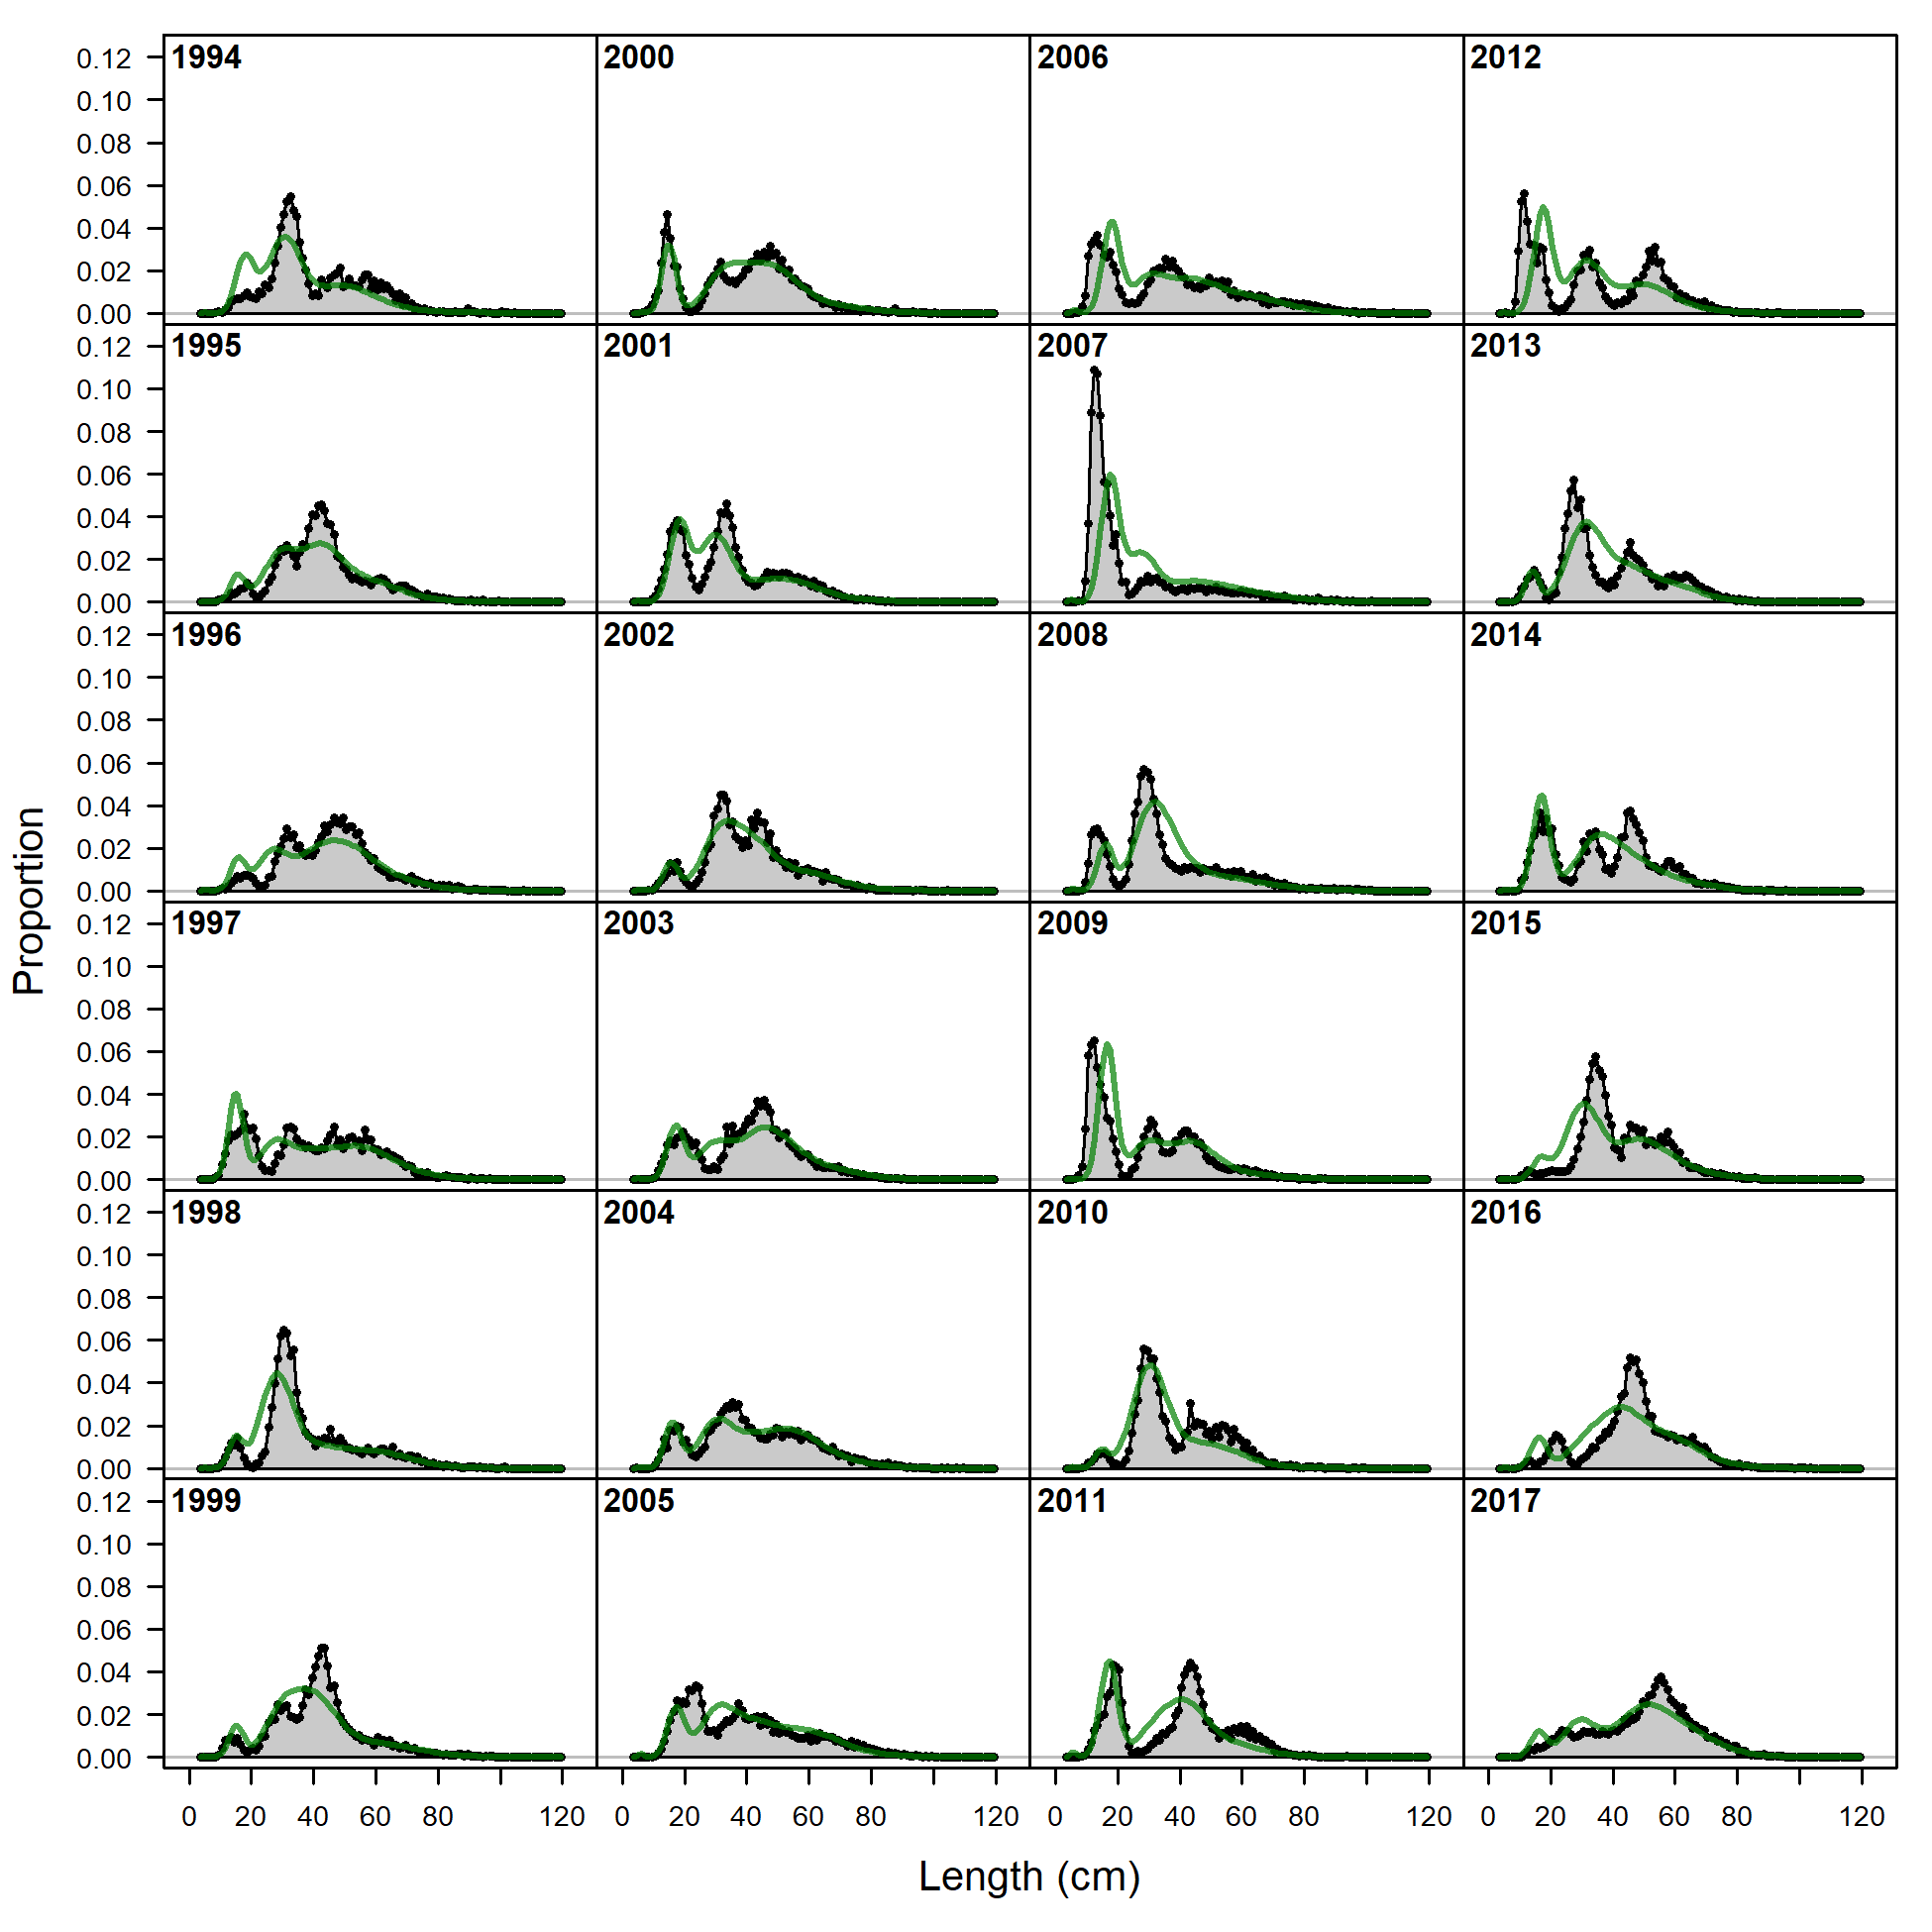
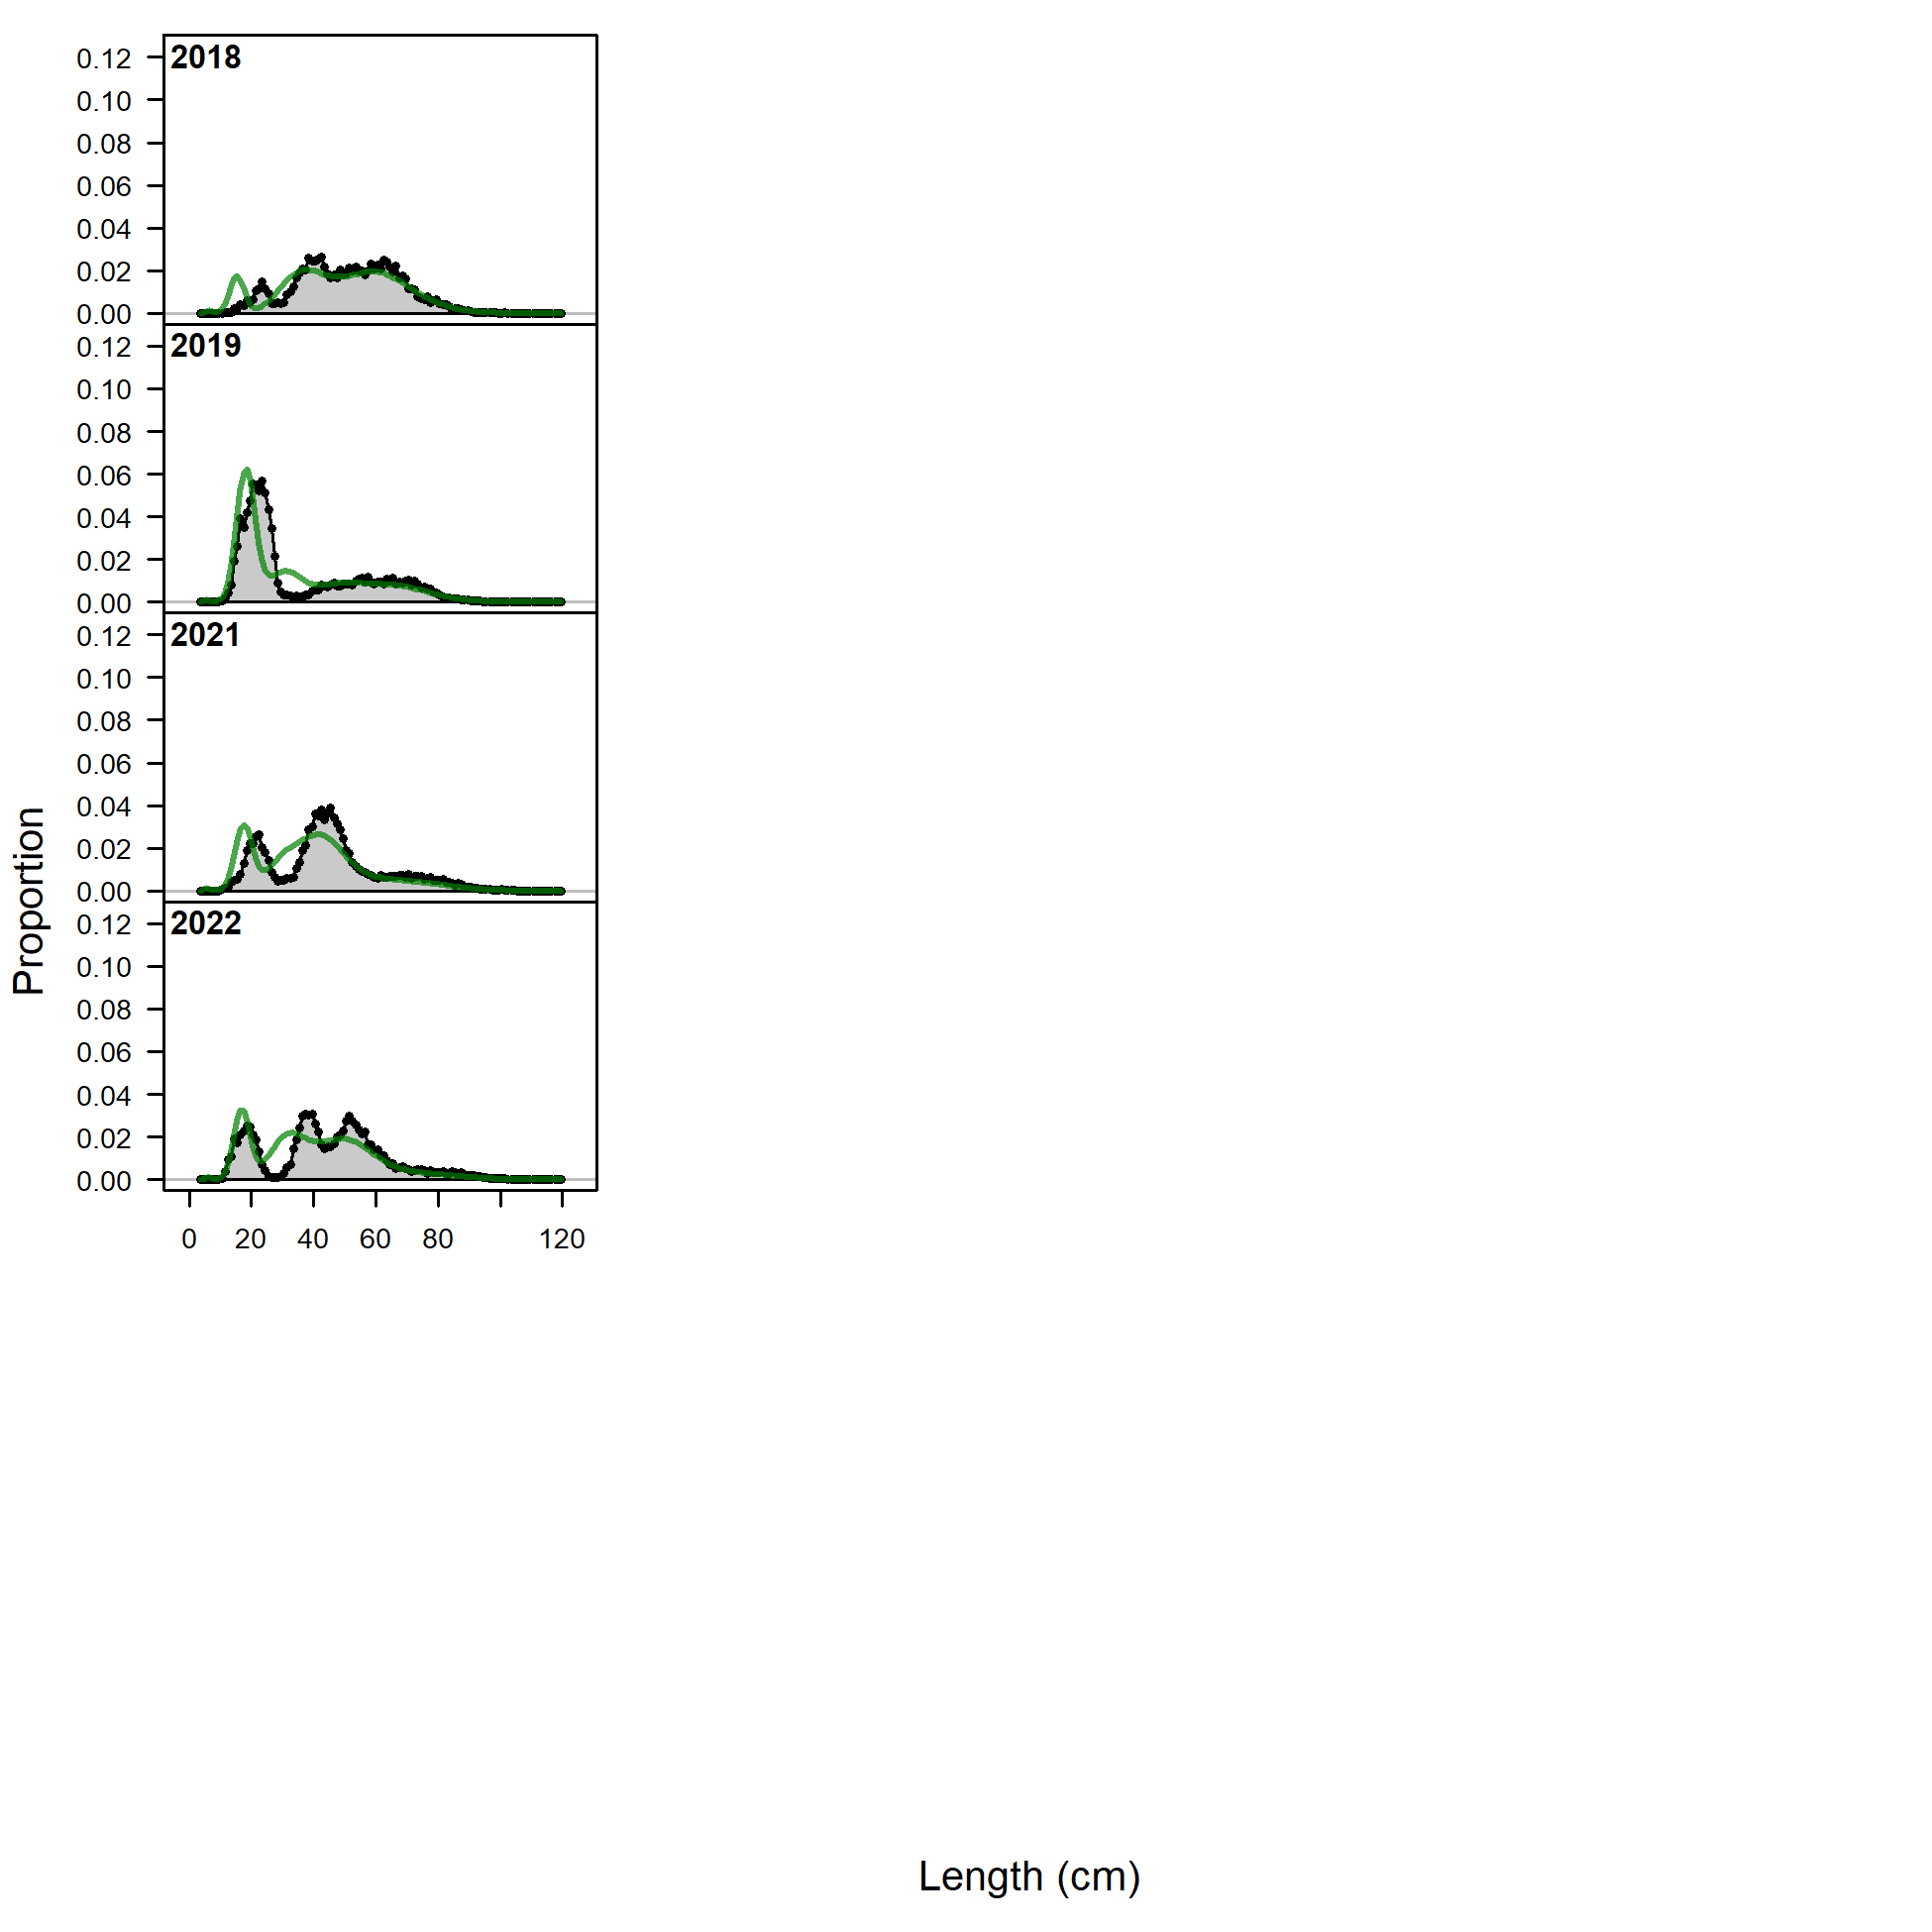
Length comps, whole catch, Survey.
'N adj.' is the input sample size after data-weighting adjustment. N eff. is the calculated effective sample size used in the McAllister-Ianelli tuning method.
file: comp_lenfit_flt2mkt0.png
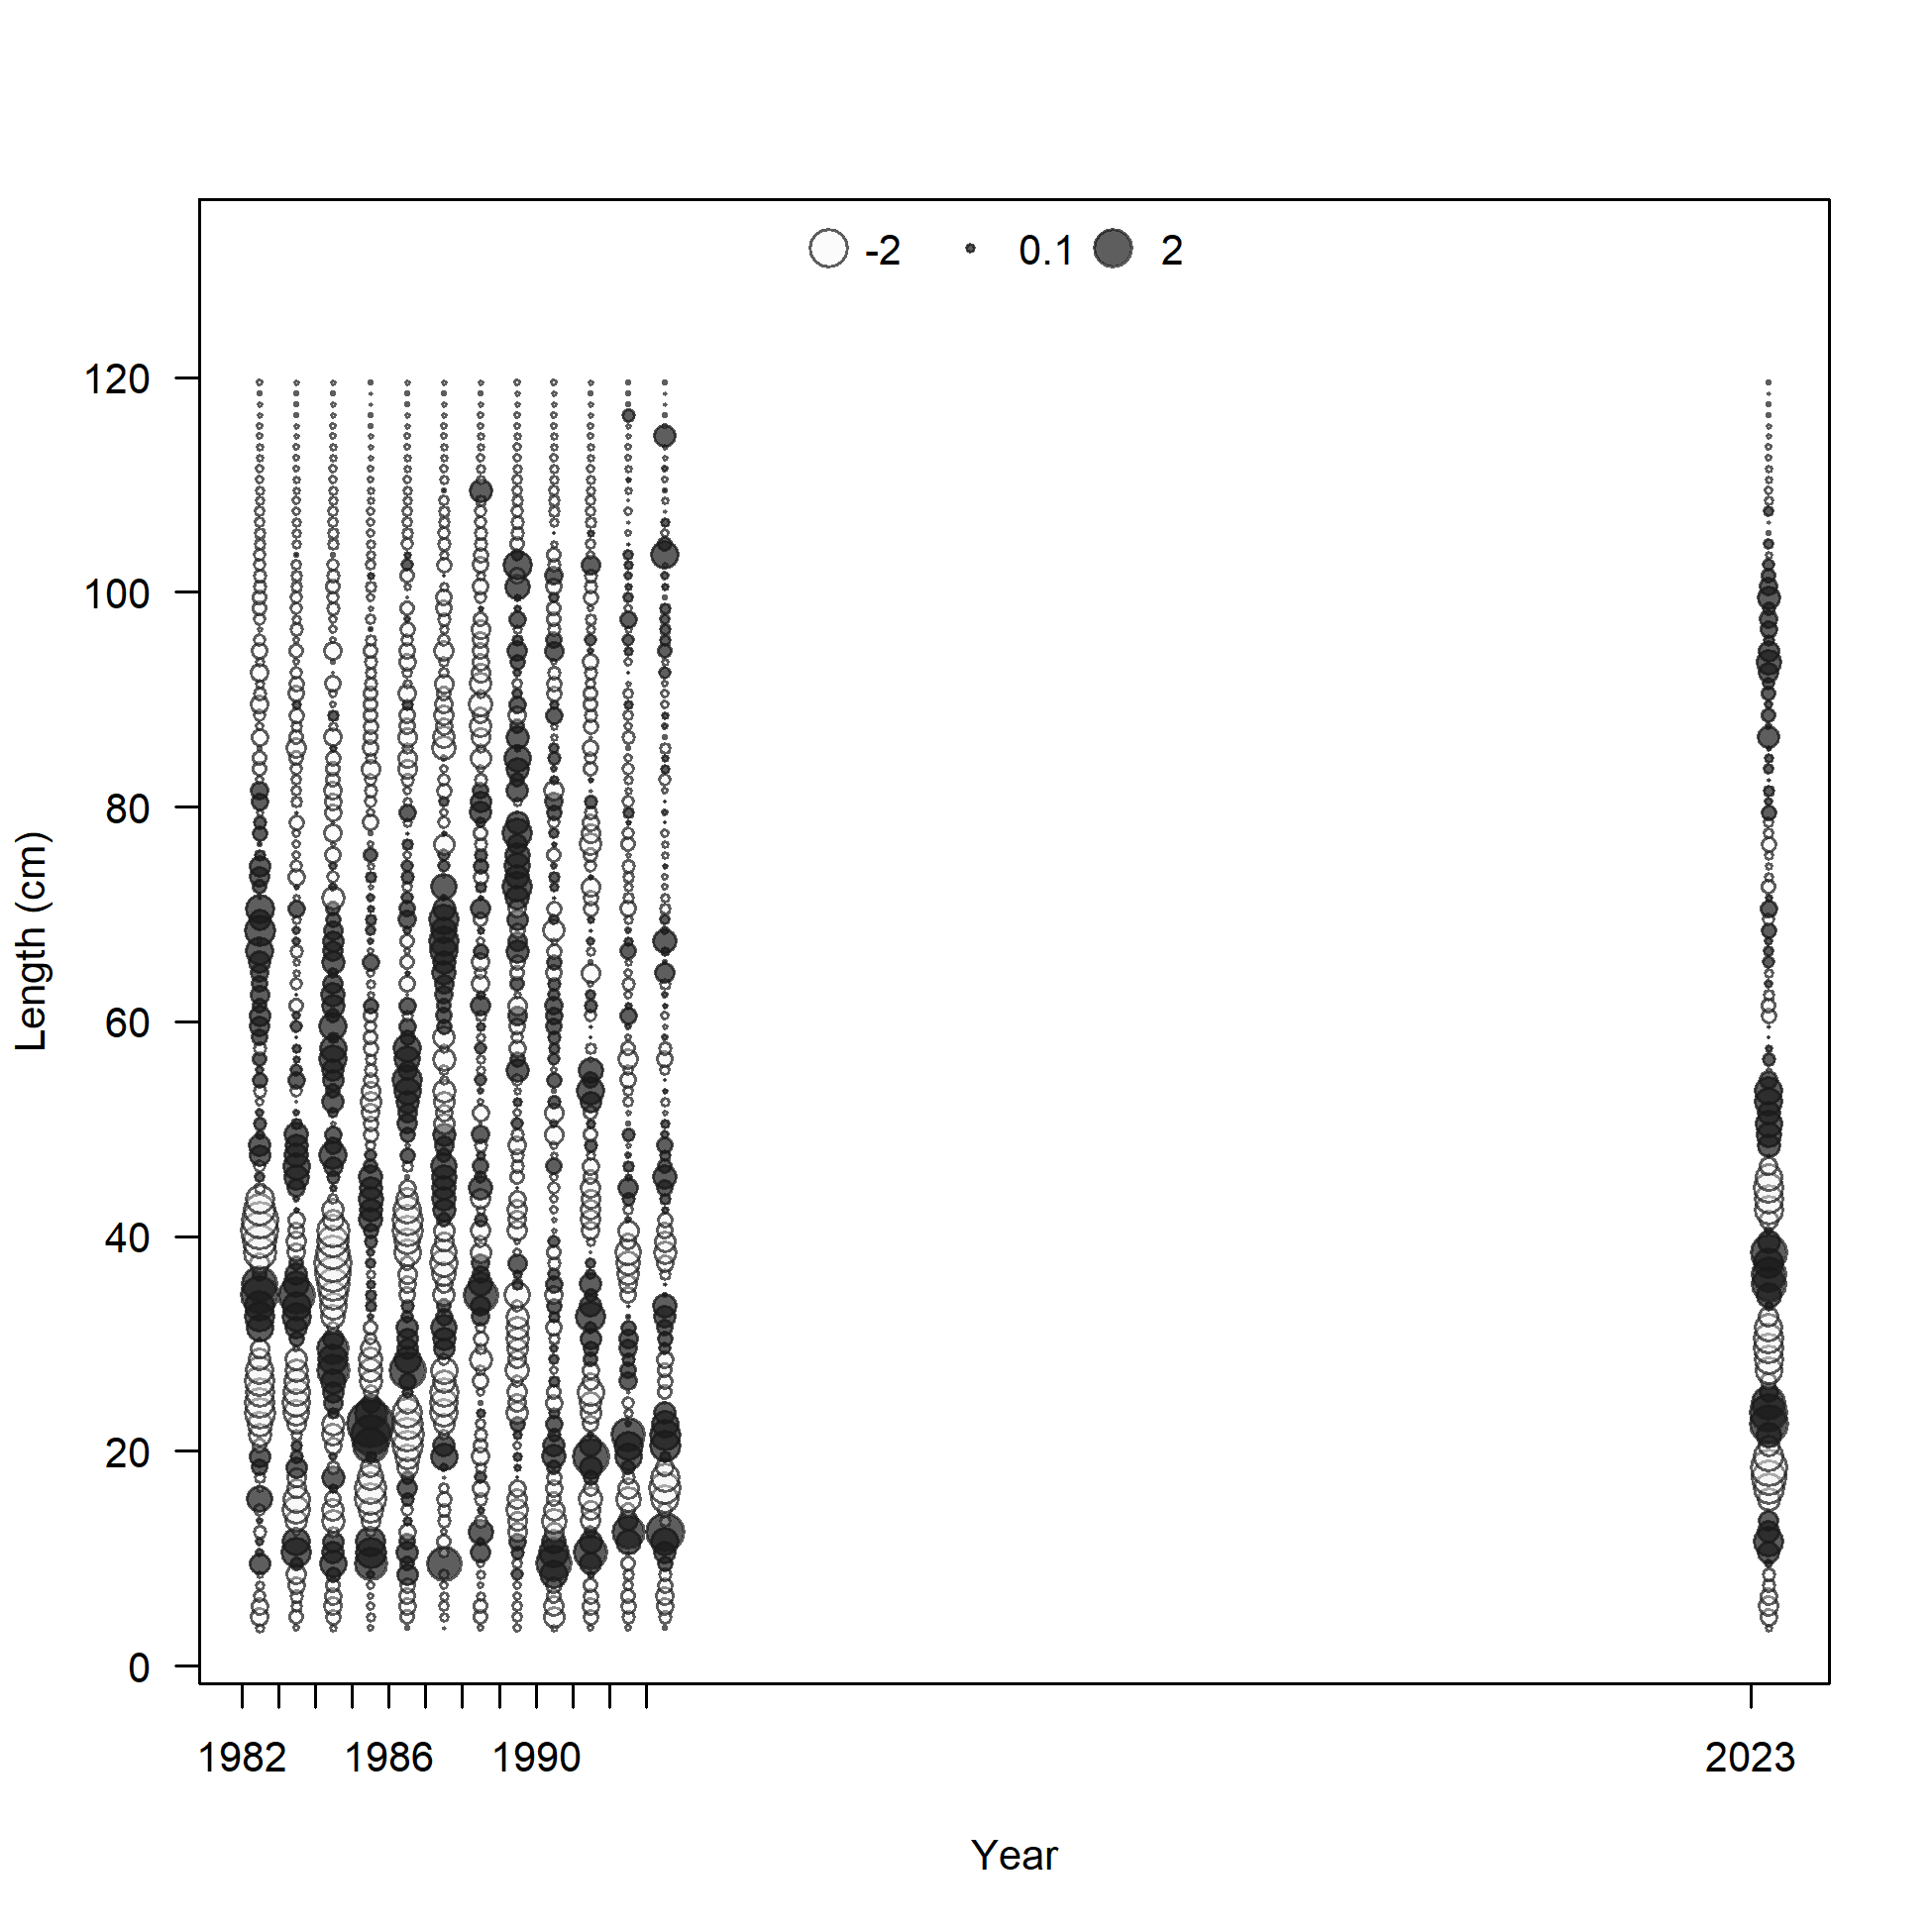
Pearson residuals, whole catch, Survey (max=2.98)
Closed bubbles are positive residuals (observed > expected) and open bubbles are negative residuals (observed < expected).
file: comp_lenfit_residsflt2mkt0.png
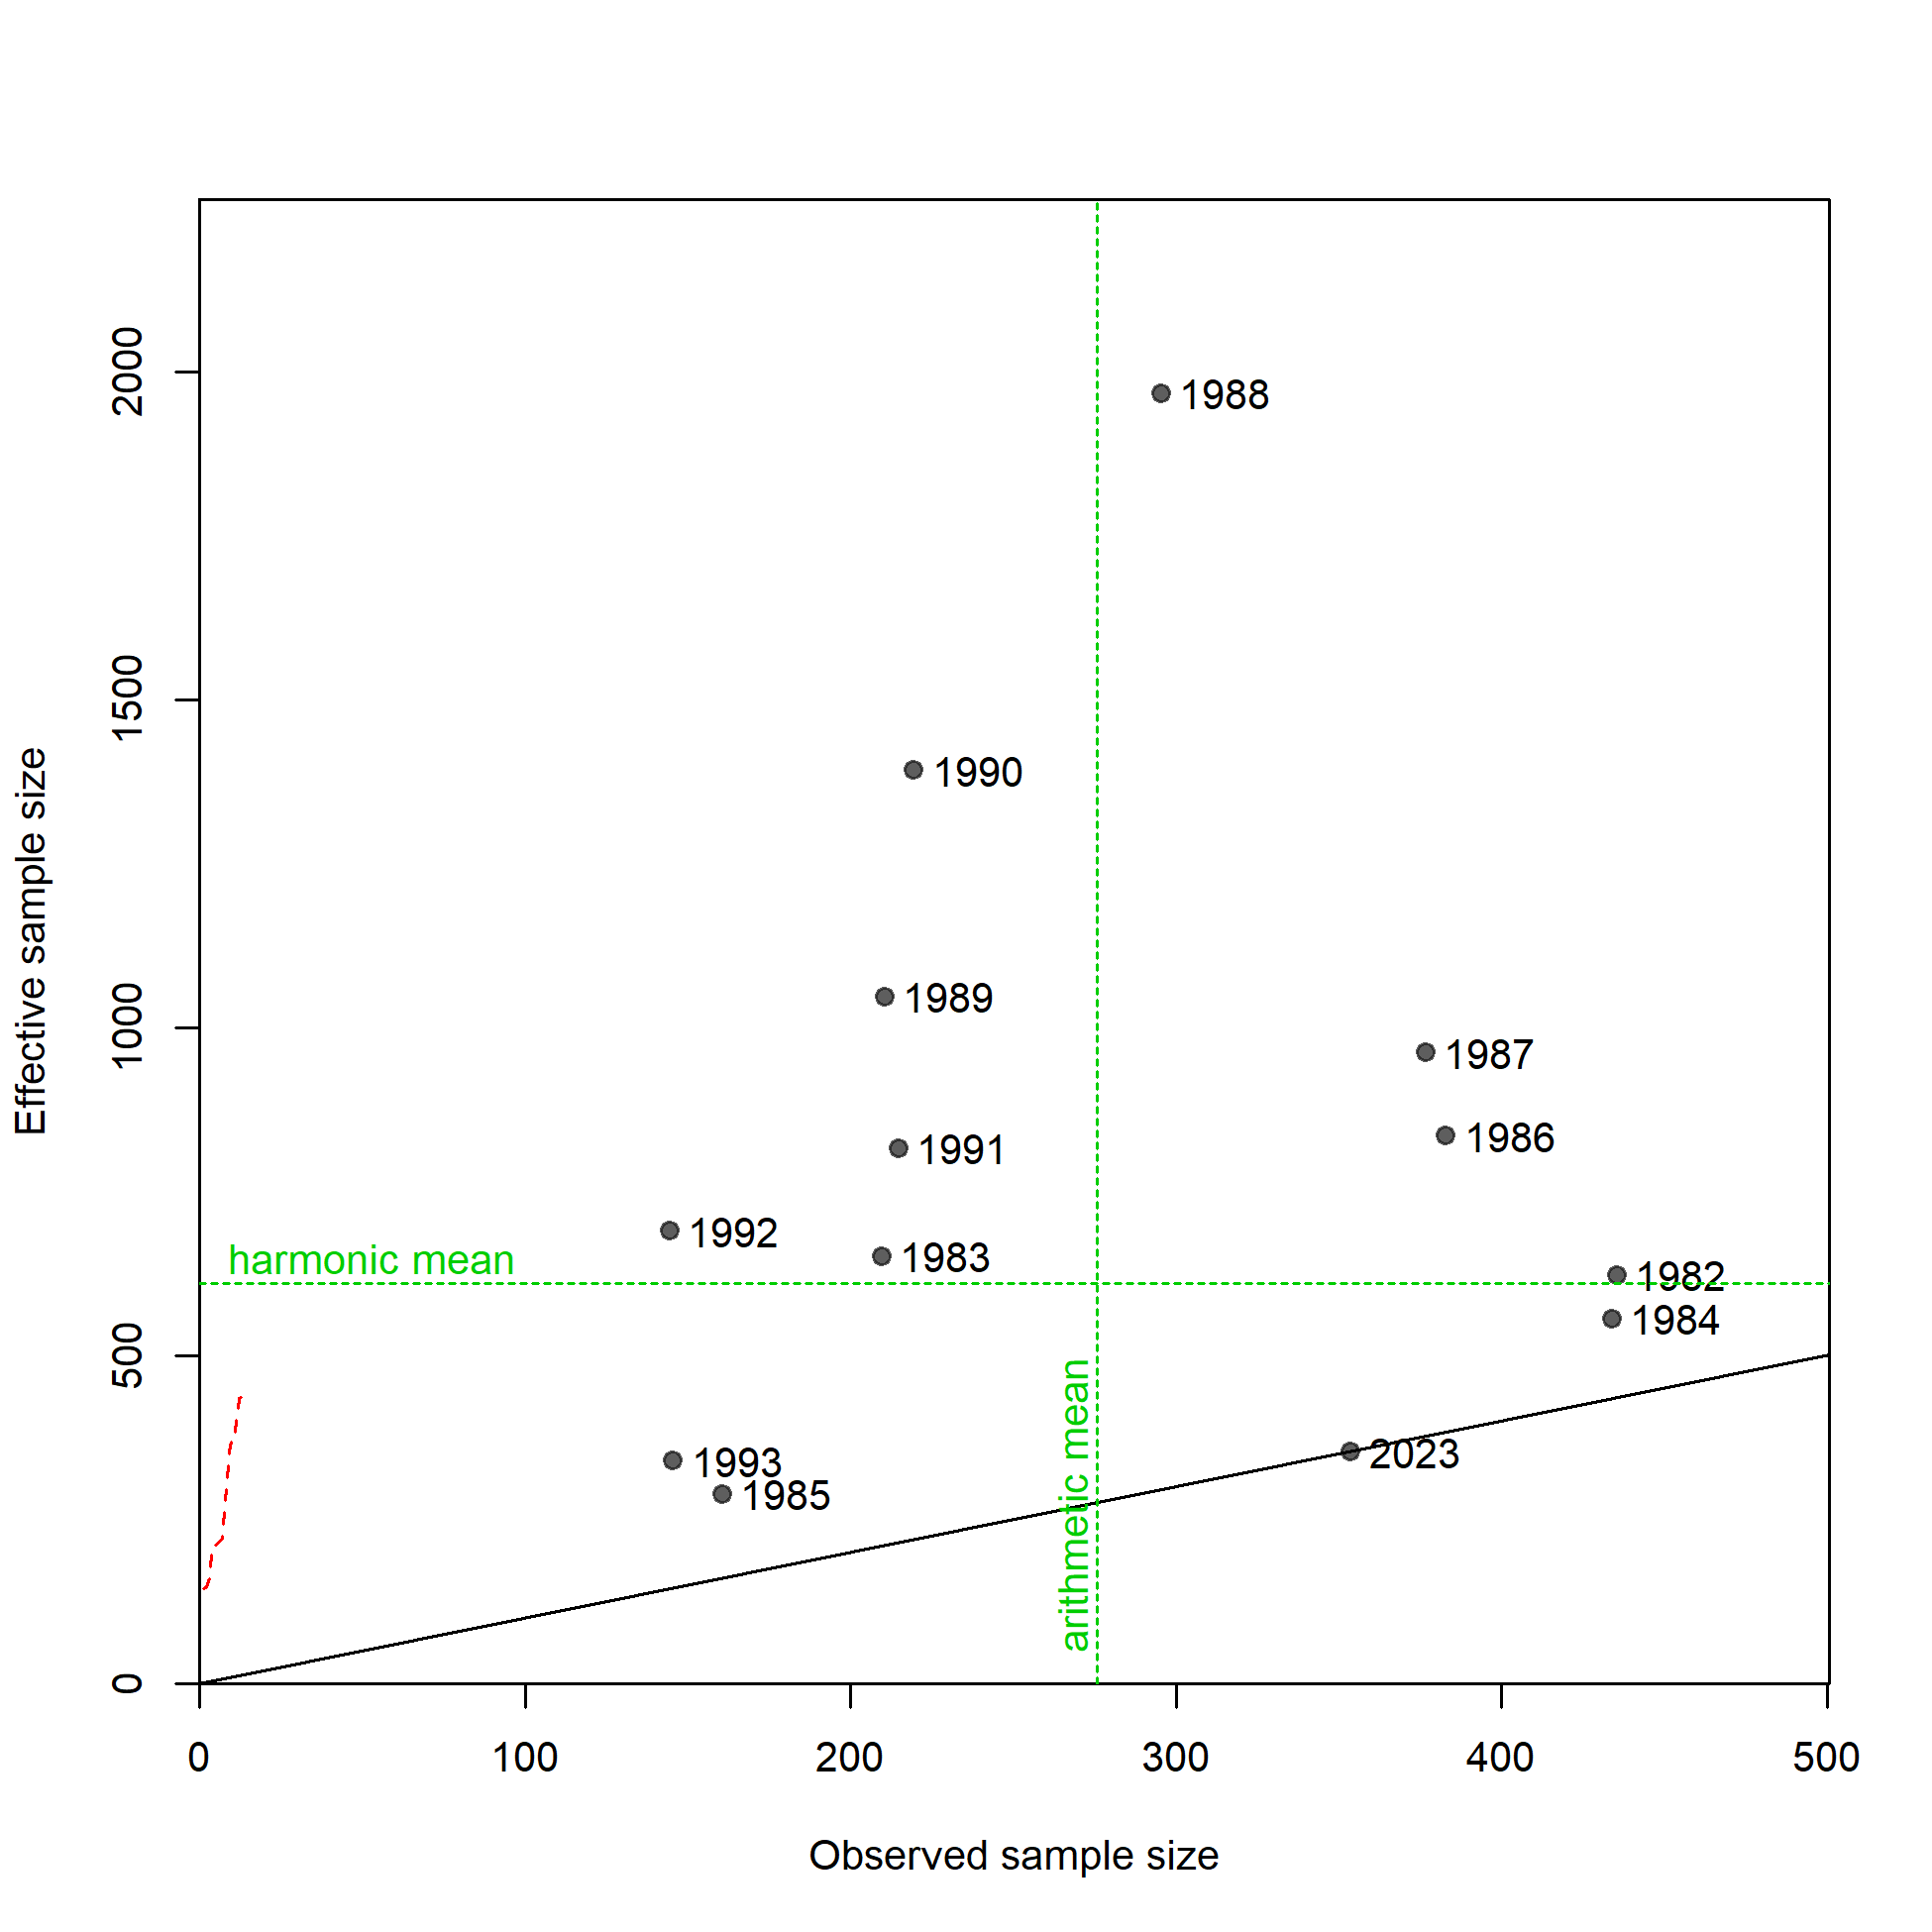
N-EffN comparison, Length comps, whole catch, Survey
file: comp_lenfit_sampsize_flt2mkt0.png
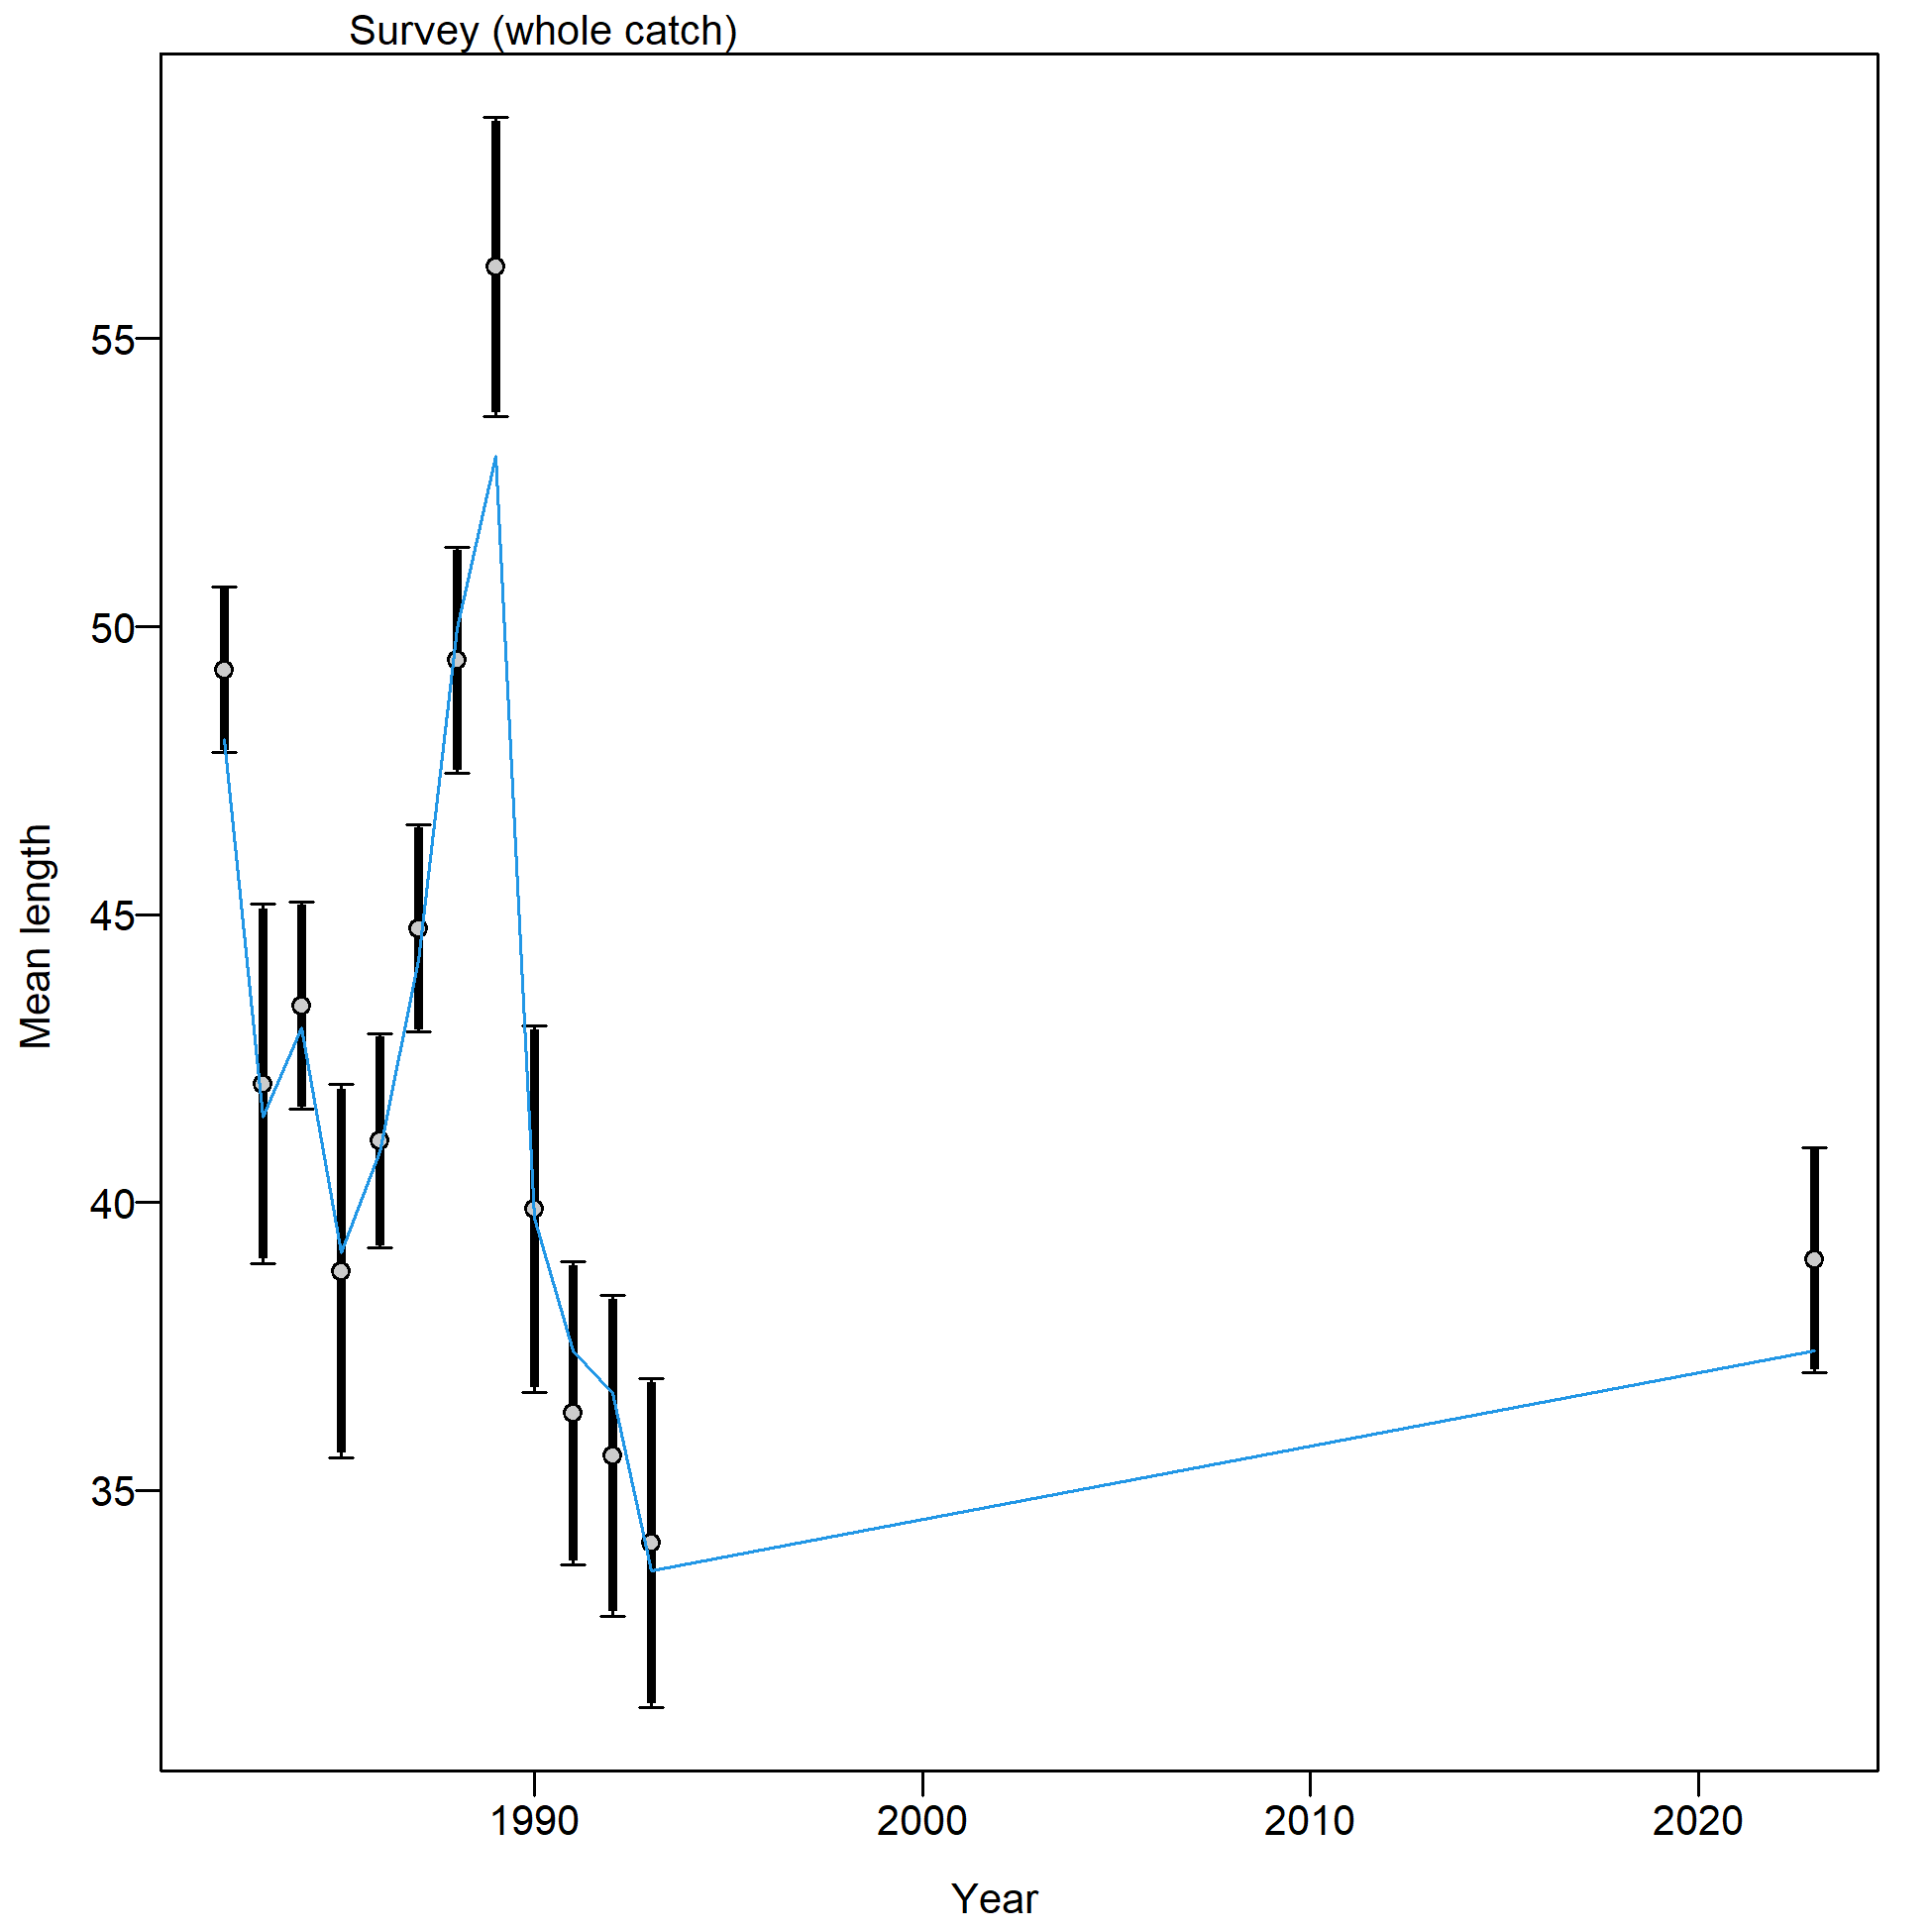
WARNING: this figure is based on multinomial likelihood and has not been updated to account for Dirichlet-Multinomial likelihood and the sample size adjustment associated with the estimated log(Θ) parameters.
Mean length for Survey with 95% confidence intervals based on current samples sizes.
Francis data weighting method TA1.8: thinner intervals (with capped ends) show result of further adjusting sample sizes based on suggested multiplier (with 95% interval) for len data from Survey:
0.9506 (0.6082-3.2808)
For more info, see
Francis, R.I.C.C. (2011). Data weighting in statistical fisheries stock assessment models. Can. J. Fish. Aquat. Sci. 68: 1124-1138. https://doi.org/10.1139/f2011-025
Excluded length comps, whole catch, Survey (plot 1 of 2).
'N adj.' is the input sample size after data-weighting adjustment. N eff. is the calculated effective sample size used in the McAllister-Ianelli tuning method.
file: comp_gstlenfit_flt2mkt0_page1.png
Excluded length comps, whole catch, Survey (plot 1 of 2).
'N adj.' is the input sample size after data-weighting adjustment. N eff. is the calculated effective sample size used in the McAllister-Ianelli tuning method. (plot 2 of 2)
file: comp_gstlenfit_flt2mkt0_page2.png

Pearson residuals, whole catch, Survey (max=NA) (plot 2 of 2)
Closed bubbles are positive residuals (observed > expected) and open bubbles are negative residuals (observed < expected).
file: comp_gstlenfit_residsflt2mkt0_page2.png