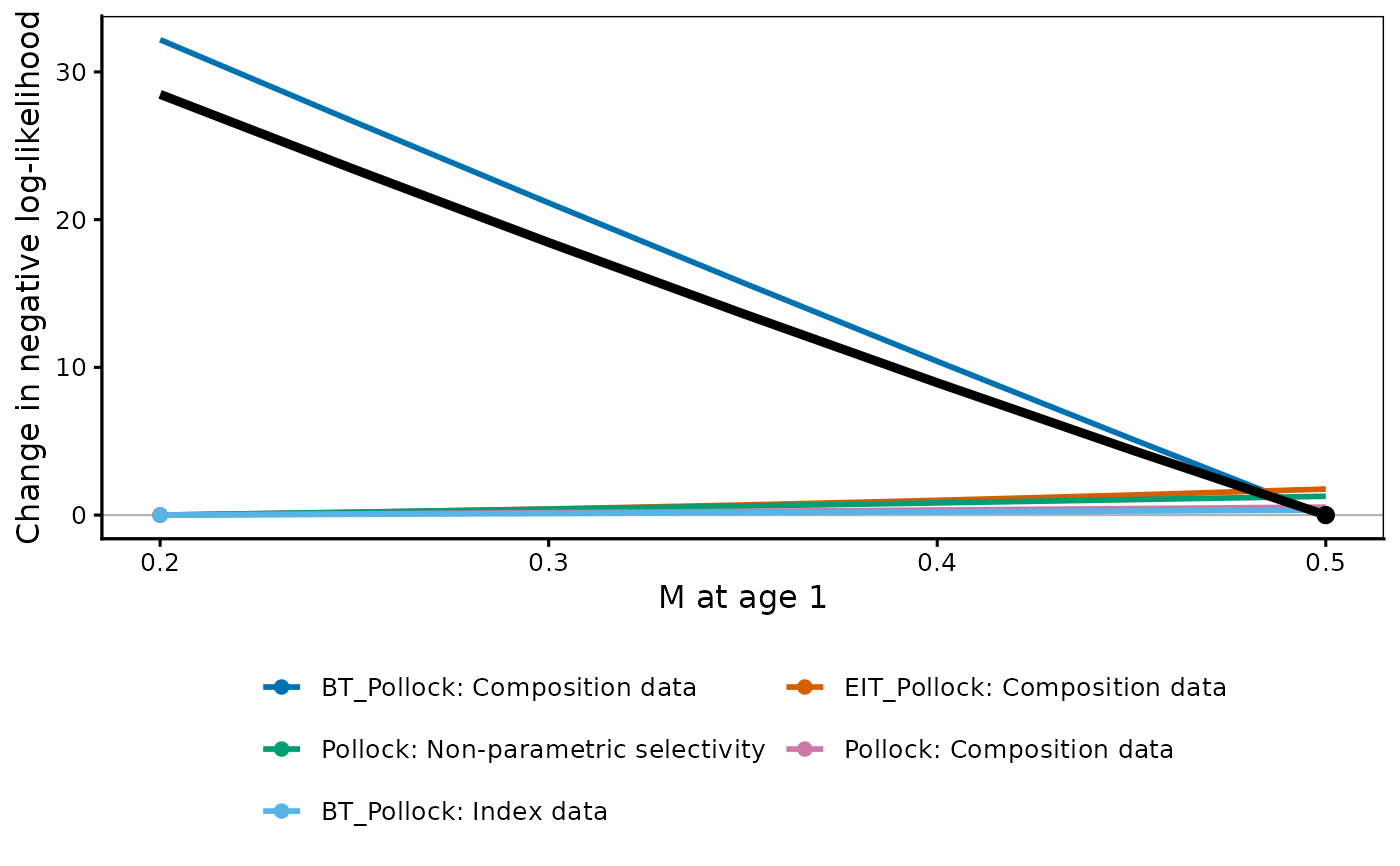
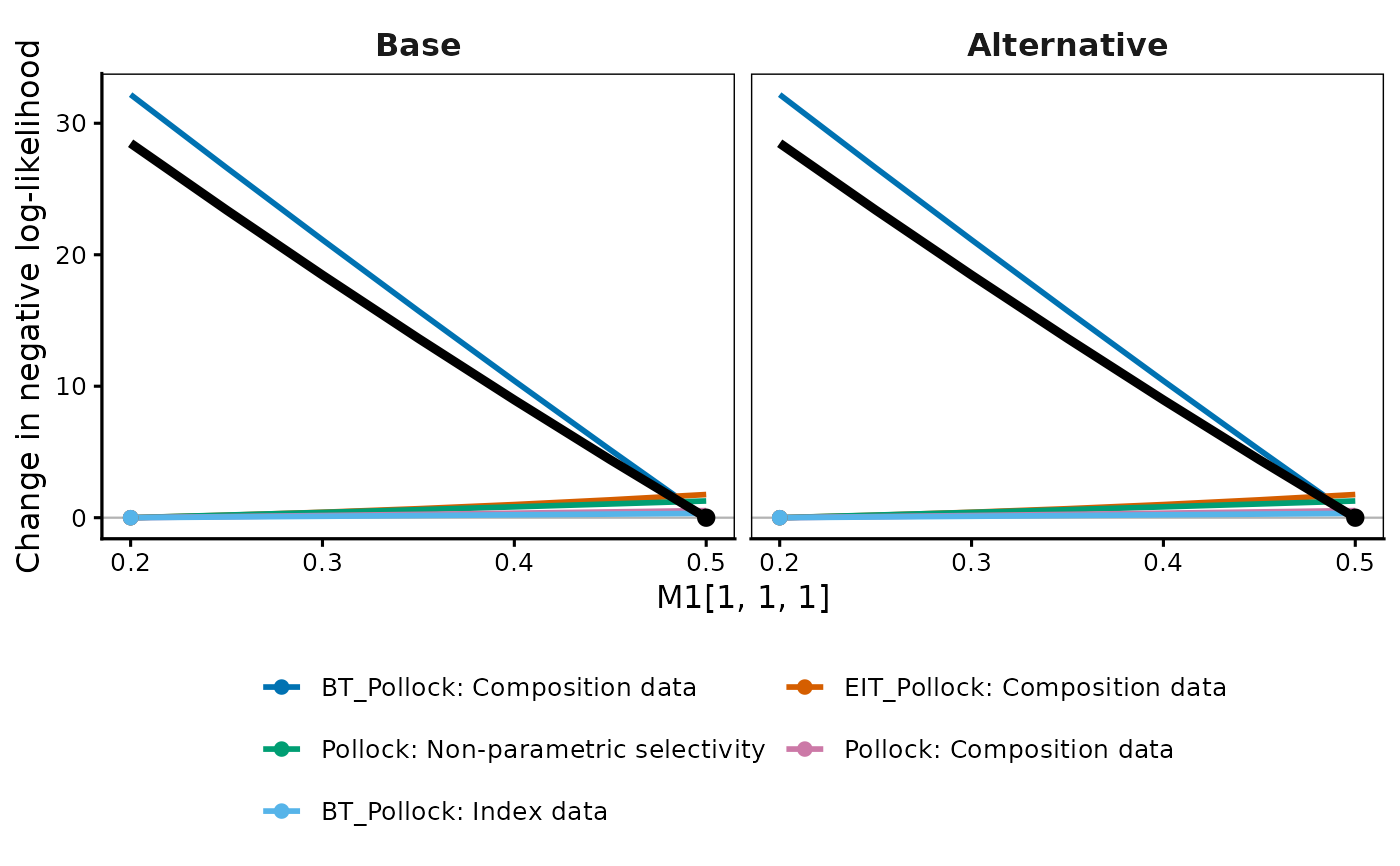
Draws each negative log-likelihood component against the
profiled parameter, with the total overlaid, in the style of
r4ss::SSplotProfile(). Where the curves disagree about which value they
prefer, the data sources are in conflict, which is what the total on its
own cannot show.
Usage
plot_profile(
  Rceattle_profile,
  model_names = NULL,
  weighted = TRUE,
  relative = c("own", "scaled", "minimum", "none"),
  minfraction = 0.01,
  add_cutoff = FALSE,
  cutoff = 1.92,
  xlab = NULL,
  ylab = NULL,
  line_col = NULL,
  lwd = 3,
  lty = 1,
  file = NULL,
  width = 7,
  height = 5
)
Arguments
- Rceattle_profile
A single
"Rceattle_profile"fromprofile.Rceattle(), or a list of them to compare models in facets.- model_names
Legend labels for the models.
- weighted, relative, minfraction
Passed to
profile_components(), which documents them.minfractiondefaults to0.01here, as inr4ss::SSplotProfile().- add_cutoff
Draw a horizontal line at
cutoff. Off by default: the cutoff is a statement about the total, and drawing it across the components invites reading it as one about them.- cutoff
Height of that line. Default
1.92, the 95% profile-likelihood cutoff for one parameter, \(\chi^2_1(0.95)/2\).- xlab
X-axis label. Default names the profiled parameter and cell in the units the grid is in.
- ylab
Y-axis label. Default follows
relative.- line_col
Line colours; names, hex, or base-graphics integers.
NULLuses the colorblind-safe Okabe-Ito palette. Applied to whichever variable the figure separates by colour, in legend order. Too few colours are recycled, with a warning.- lwd
Line width on the base-graphics scale: the default
3renders as a standard-weight ggplot line. A vector varies it across series.- lty
Line type. A vector varies it across the levels of whatever the figure separates by line type.
- file
Optional file stem; the figure is written to
<file>_<suffix>.pngif given.- width, height
Saved figure size in inches.
Value
A ggplot object. Its $data is the plotted frame, so the numbers
behind the figure can be read back off it.
Details
Read the figure by where each curve bottoms out, not by how deep it is. Every
series is re-zeroed at its own minimum and a point marks that minimum, so the
spread of the points along the x axis is the disagreement: components whose
points sit together support the same value, and one whose point sits far from
the total's is pulling against the rest. Where one component dwarfs the
others it sets the y axis and the rest flatten onto the bottom;
relative = "scaled" puts every curve on 0 to 1 so the minima stay
comparable, and relative = "minimum" re-zeroes every series at the total's
minimum, showing what each gives up by moving away from the fitted value.
profile_components() documents all of them, and the magnitude "scaled"
discards.
The total is drawn solid and black at 1.6 times lwd, and kept out of the
colour legend, so it stays the reference line whatever the components are
styled as; line_col, lwd and lty therefore apply to the
components. Series are ordered, in the legend and the palette, by how
much each moves over the grid. Under joint = "multiply" or "add" a dotted
vertical line marks the fitted model (a multiplier of 1, an offset of 0).
Non-converged grid points leave a gap.
References
Taylor, I.G., et al. (2021) Beyond visualizing catch-at-age models: Lessons learned from the r4ss package about software to support stock assessments. Fisheries Research 239: 105924.
See also
profile_components() for the same numbers as a data frame,
profile.Rceattle() to run the profile, print.Rceattle_profile() for
whether the grid brackets the minimum.
Examples
# \donttest{
data(BS2017SS)
ss_run <- fit_mod(data_list = BS2017SS, inits = NULL, file = NULL,
estimateMode = 0, random_rec = FALSE, msmMode = 0, avgnMode = 0,
phase = FALSE, verbose = 0)
#> Warning: Passing ‘phase’, ‘verbose’ directly to fit_mod() is deprecated and will be removed in a future release. Bundle these into fit_control() instead, e.g. fit_control(phase = ..., verbose = ...). Forwarding for now.
#> `age_trans_matrix` data does not span range of age for species 1 will fill with 0s
# Profile M for species 1 and see which data sources disagree about it
prof <- profile(ss_run, param = "M1", slots = list(c(1, 1, 1)),
values = list(seq(0.2, 0.5, by = 0.05)))
plot_profile(prof, xlab = "M at age 1")
 # Two model configurations side by side
plot_profile(list(prof, prof), model_names = c("Base", "Alternative"))
 # }