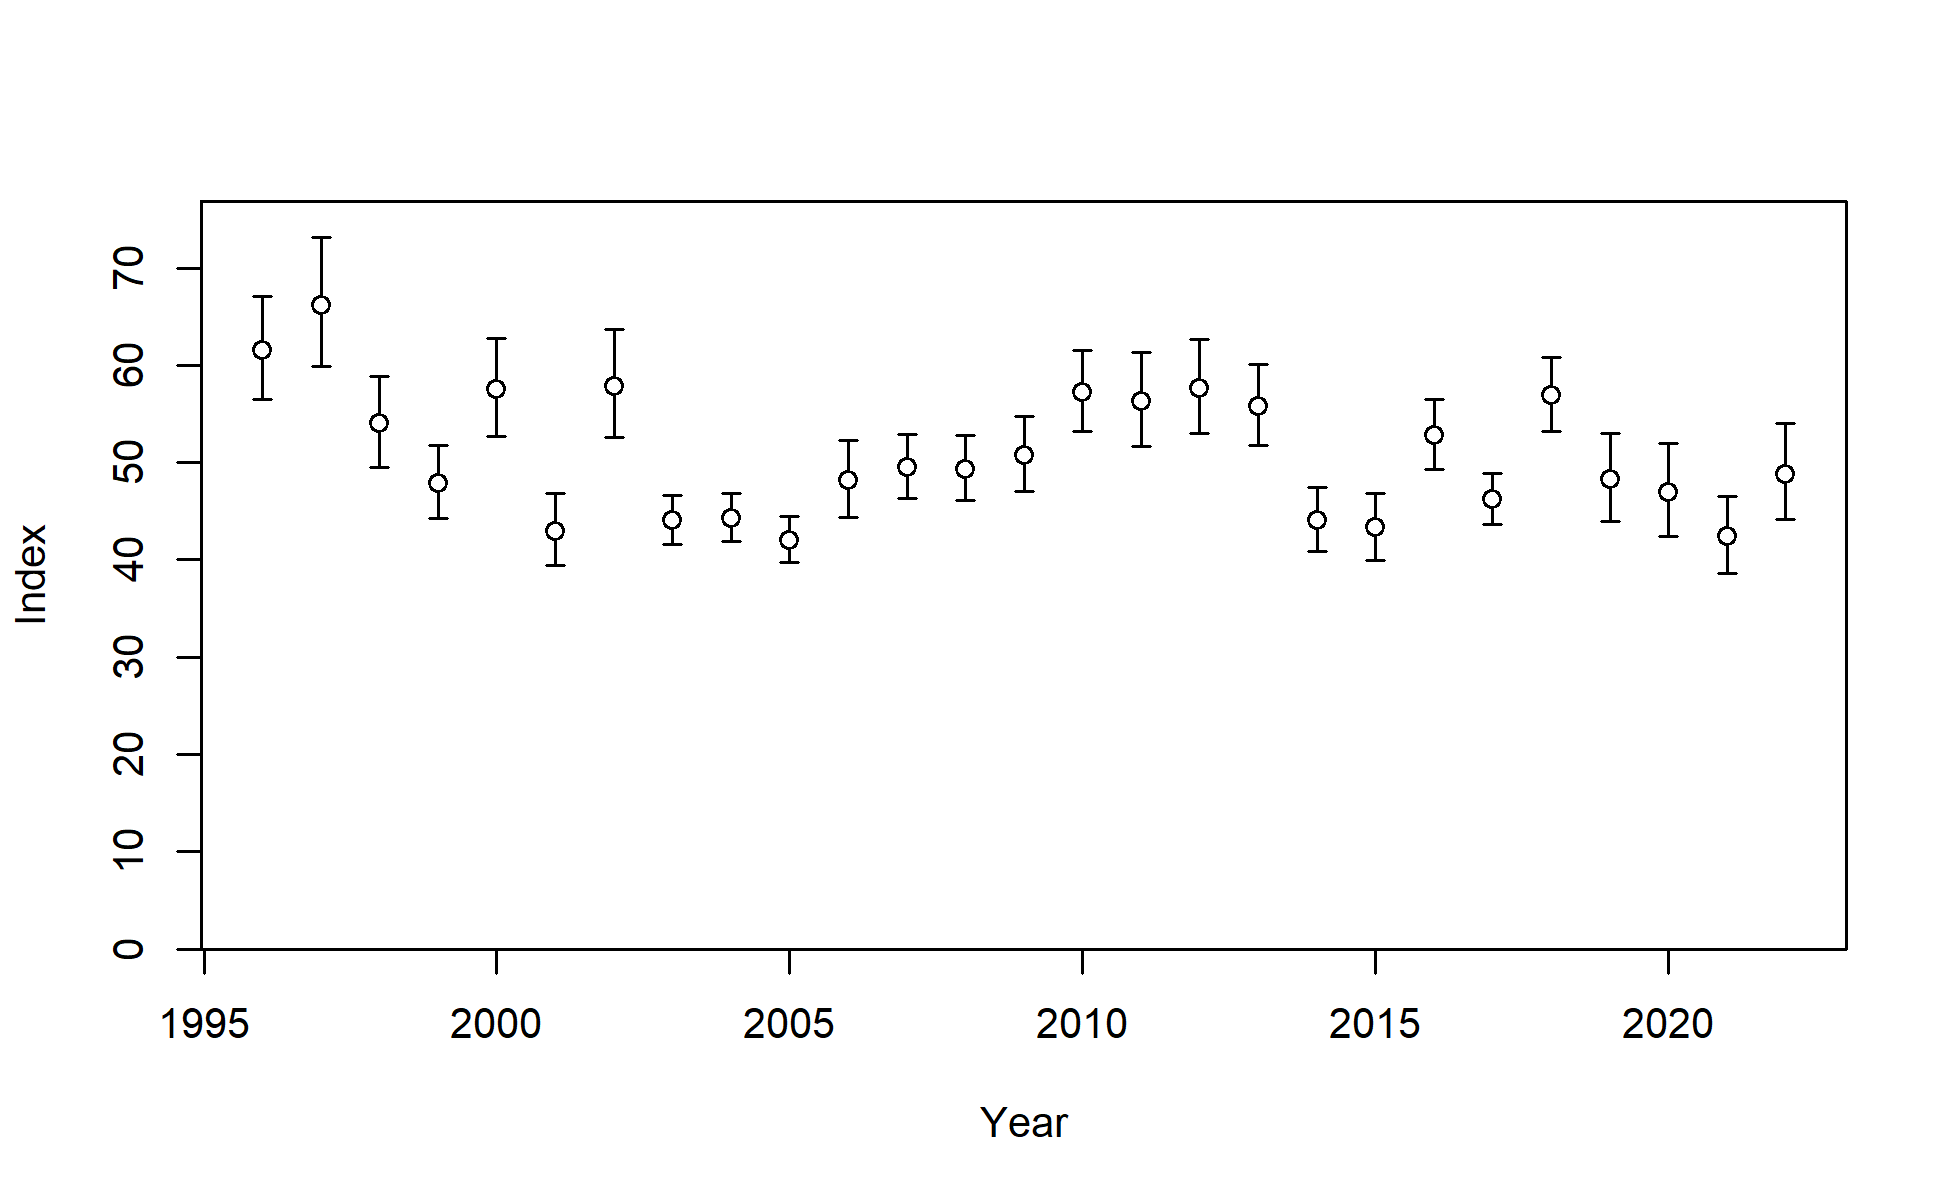
Index data for Fishery. Lines indicate 95% uncertainty interval around index values based on the model assumption of lognormal error. Thicker lines (if present) indicate input uncertainty before addition of estimated additional uncertainty parameter.
file: index1_cpuedata_Fishery.png
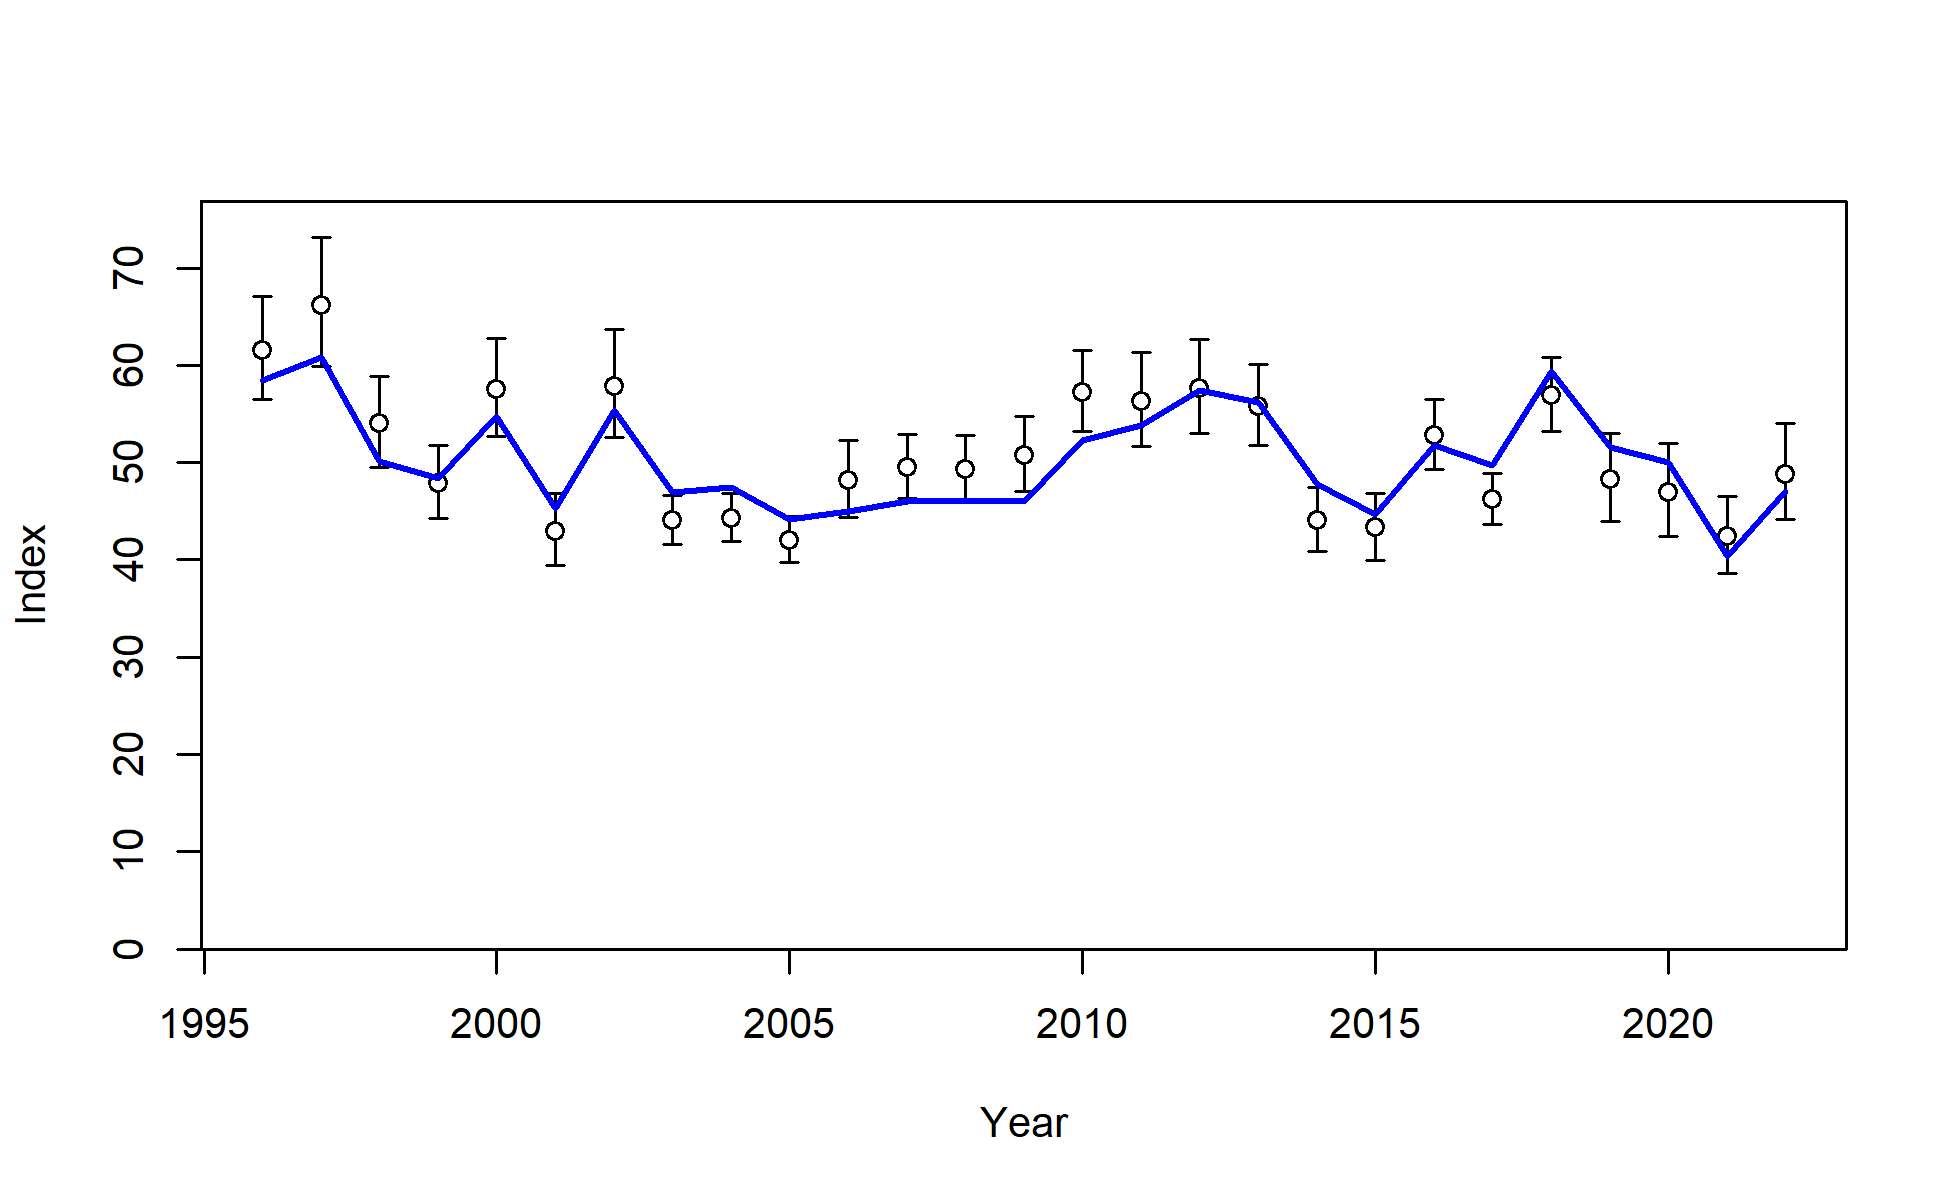
Fit to index data for Fishery. Lines indicate 95% uncertainty interval around index values based on the model assumption of lognormal error. Thicker lines (if present) indicate input uncertainty before addition of estimated additional uncertainty parameter.
file: index2_cpuefit_Fishery.png
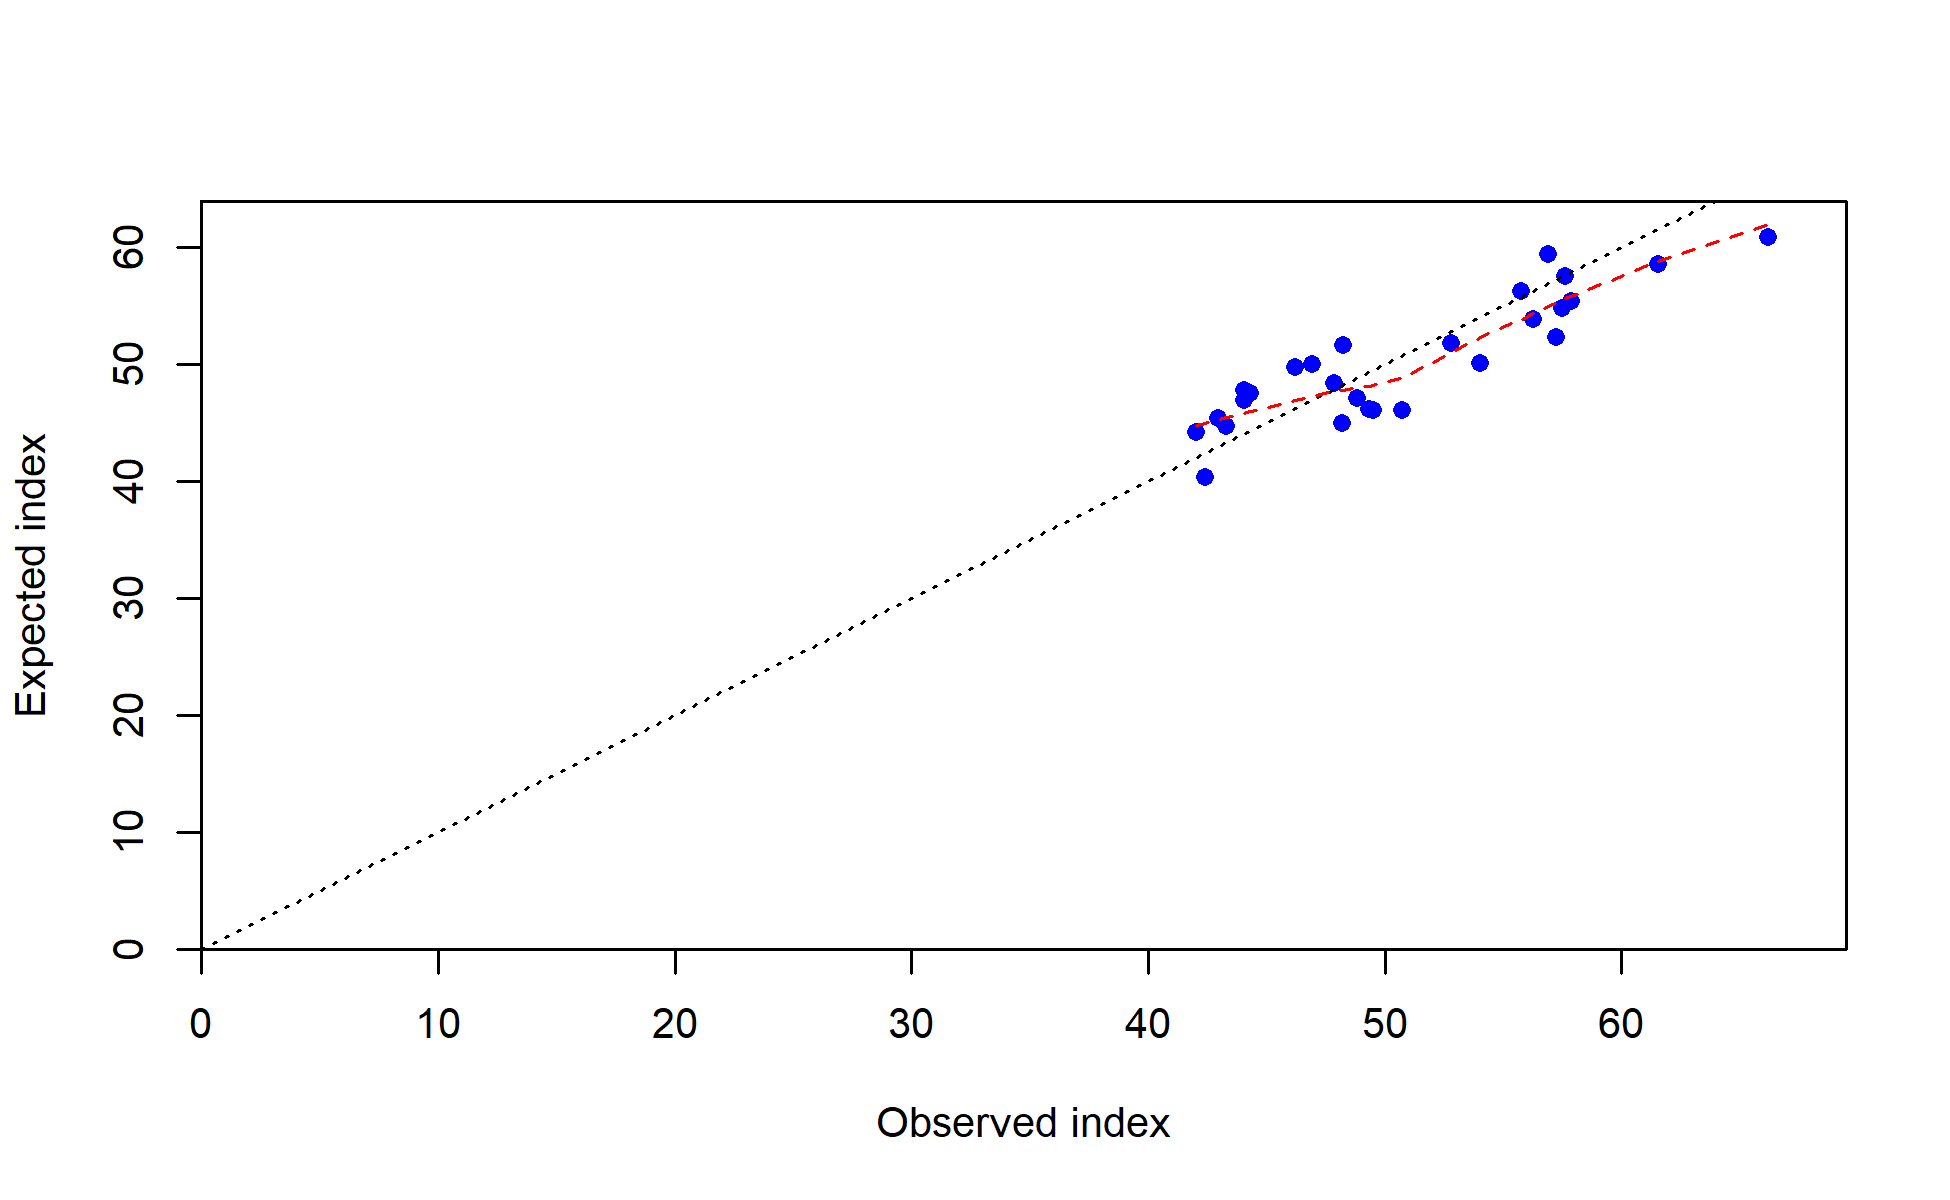
Observed vs. expected index values with smoother for Fishery
file: index3_obs_vs_exp_Fishery.png
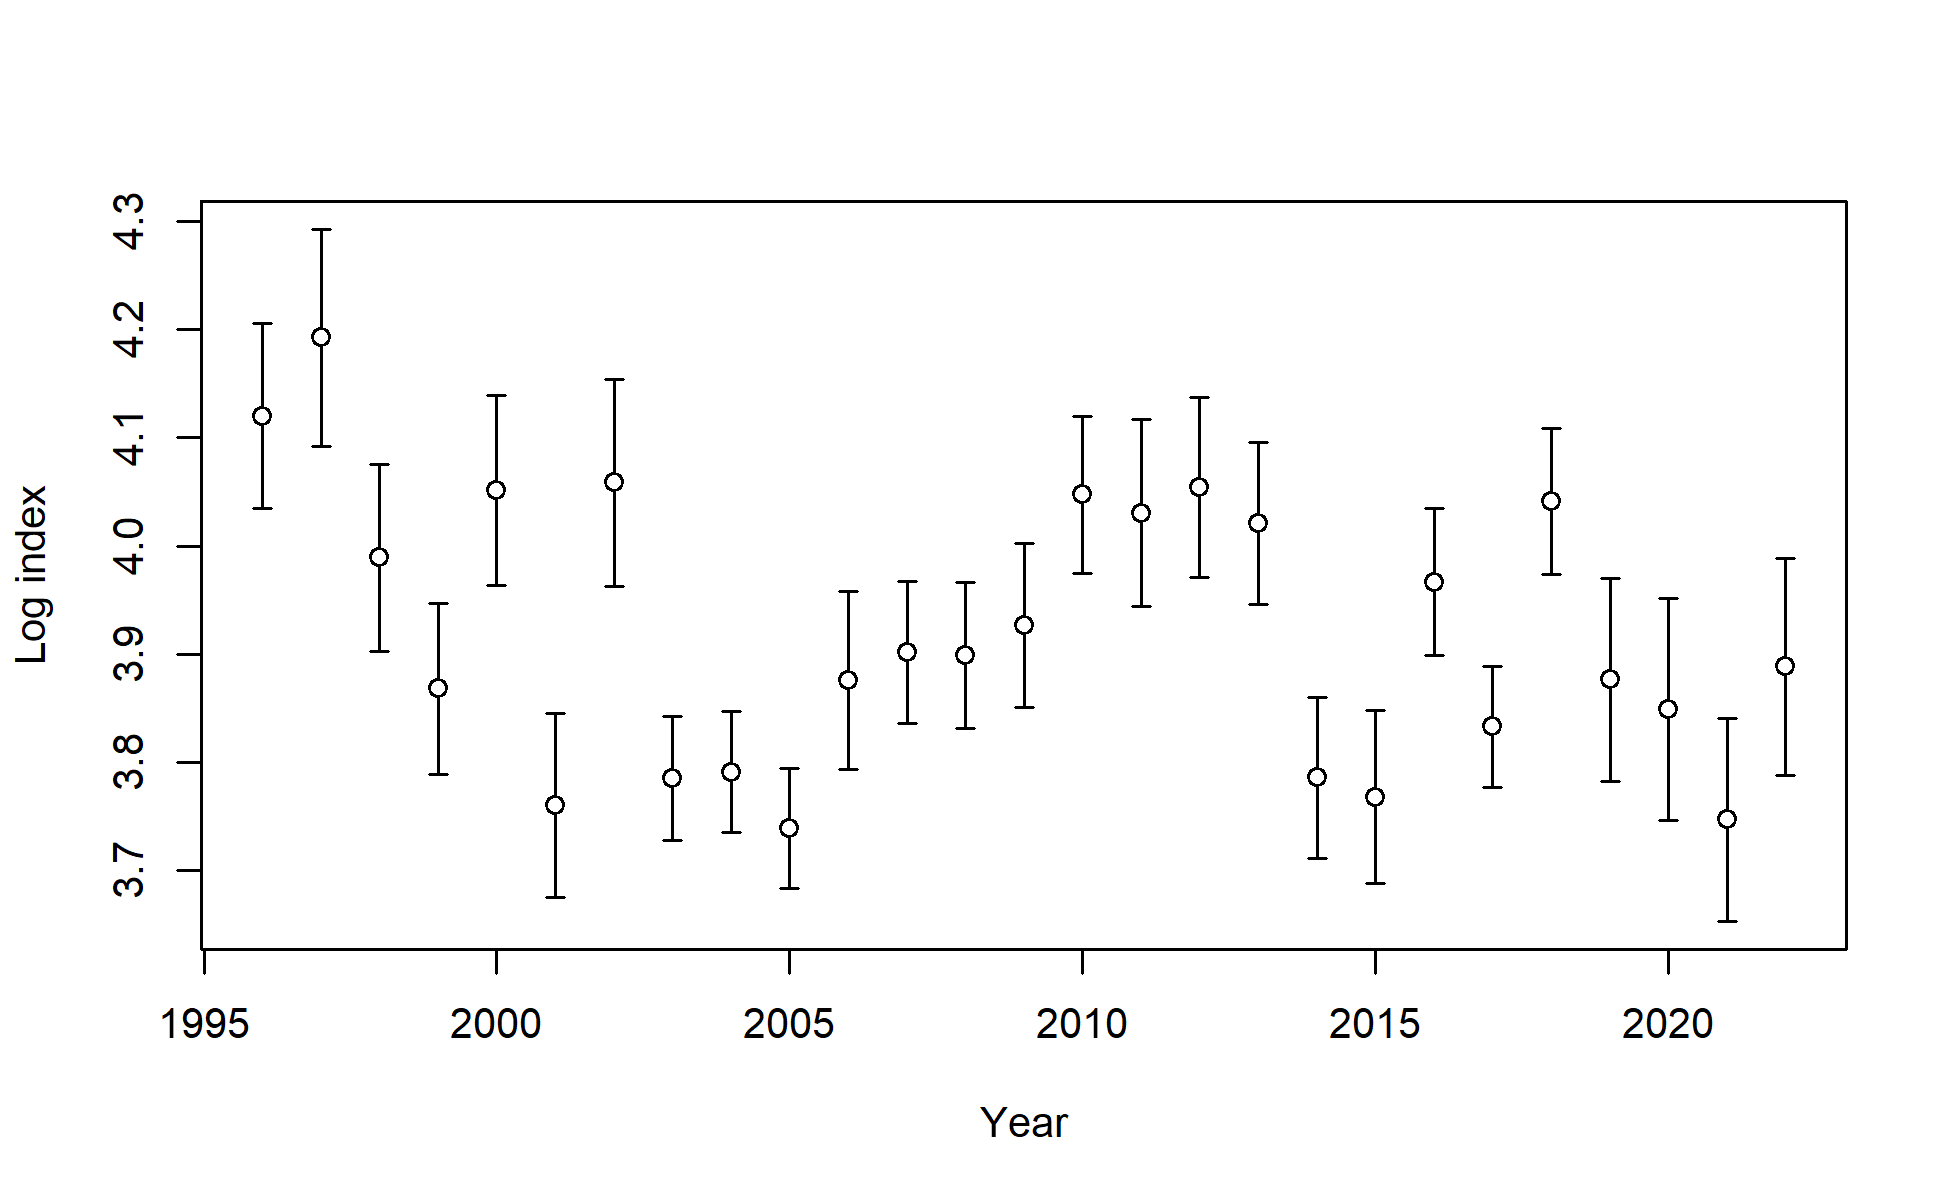
Log index data for Fishery. Lines indicate 95% uncertainty interval around index values based on the model assumption of lognormal error. Thicker lines (if present) indicate input uncertainty before addition of estimated additional uncertainty parameter.
file: index4_logcpuedata_Fishery.png
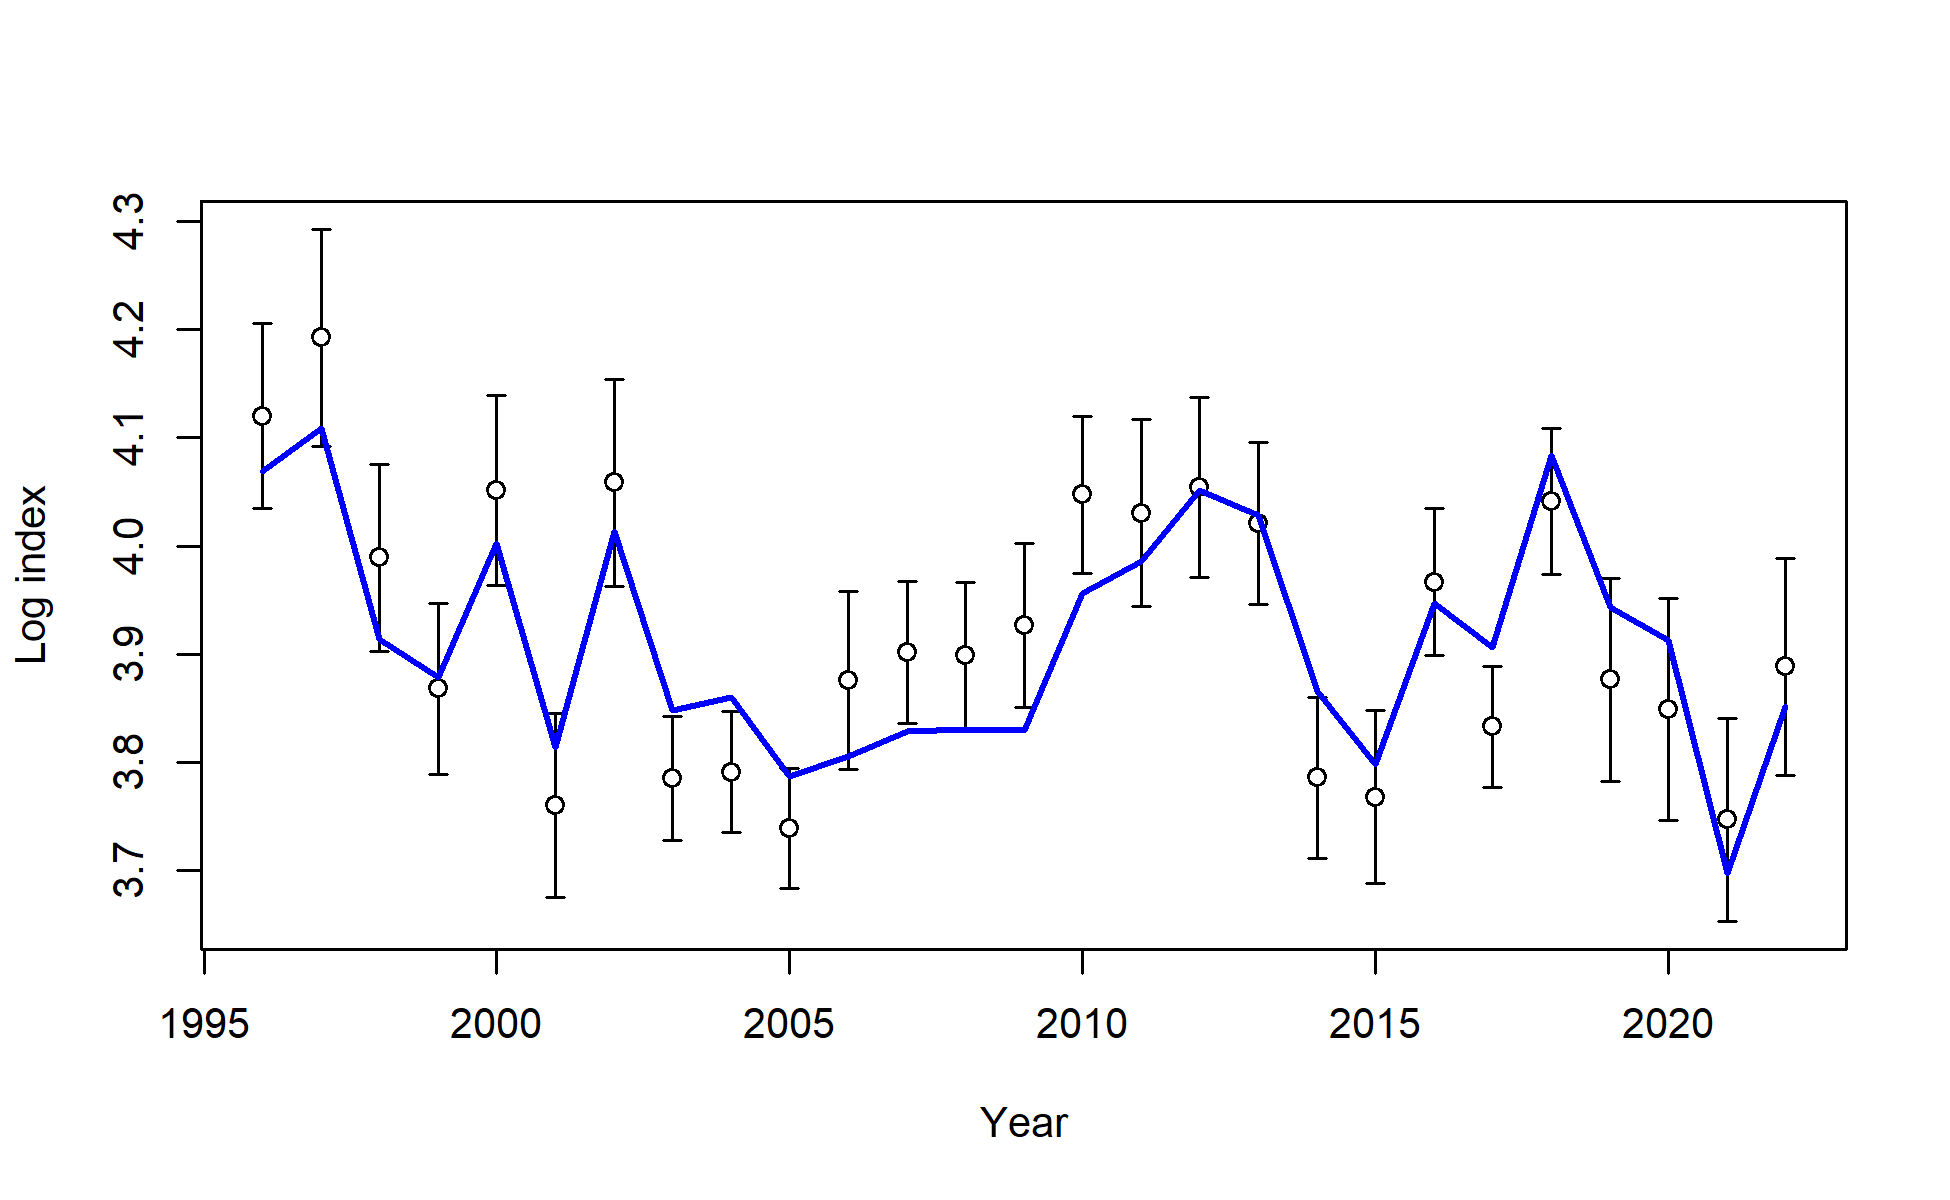
Fit to log index data on log scale for Fishery. Lines indicate 95% uncertainty interval around index values based on the model assumption of lognormal error. Thicker lines (if present) indicate input uncertainty before addition of estimated additional uncertainty parameter.
file: index5_logcpuefit_Fishery.png
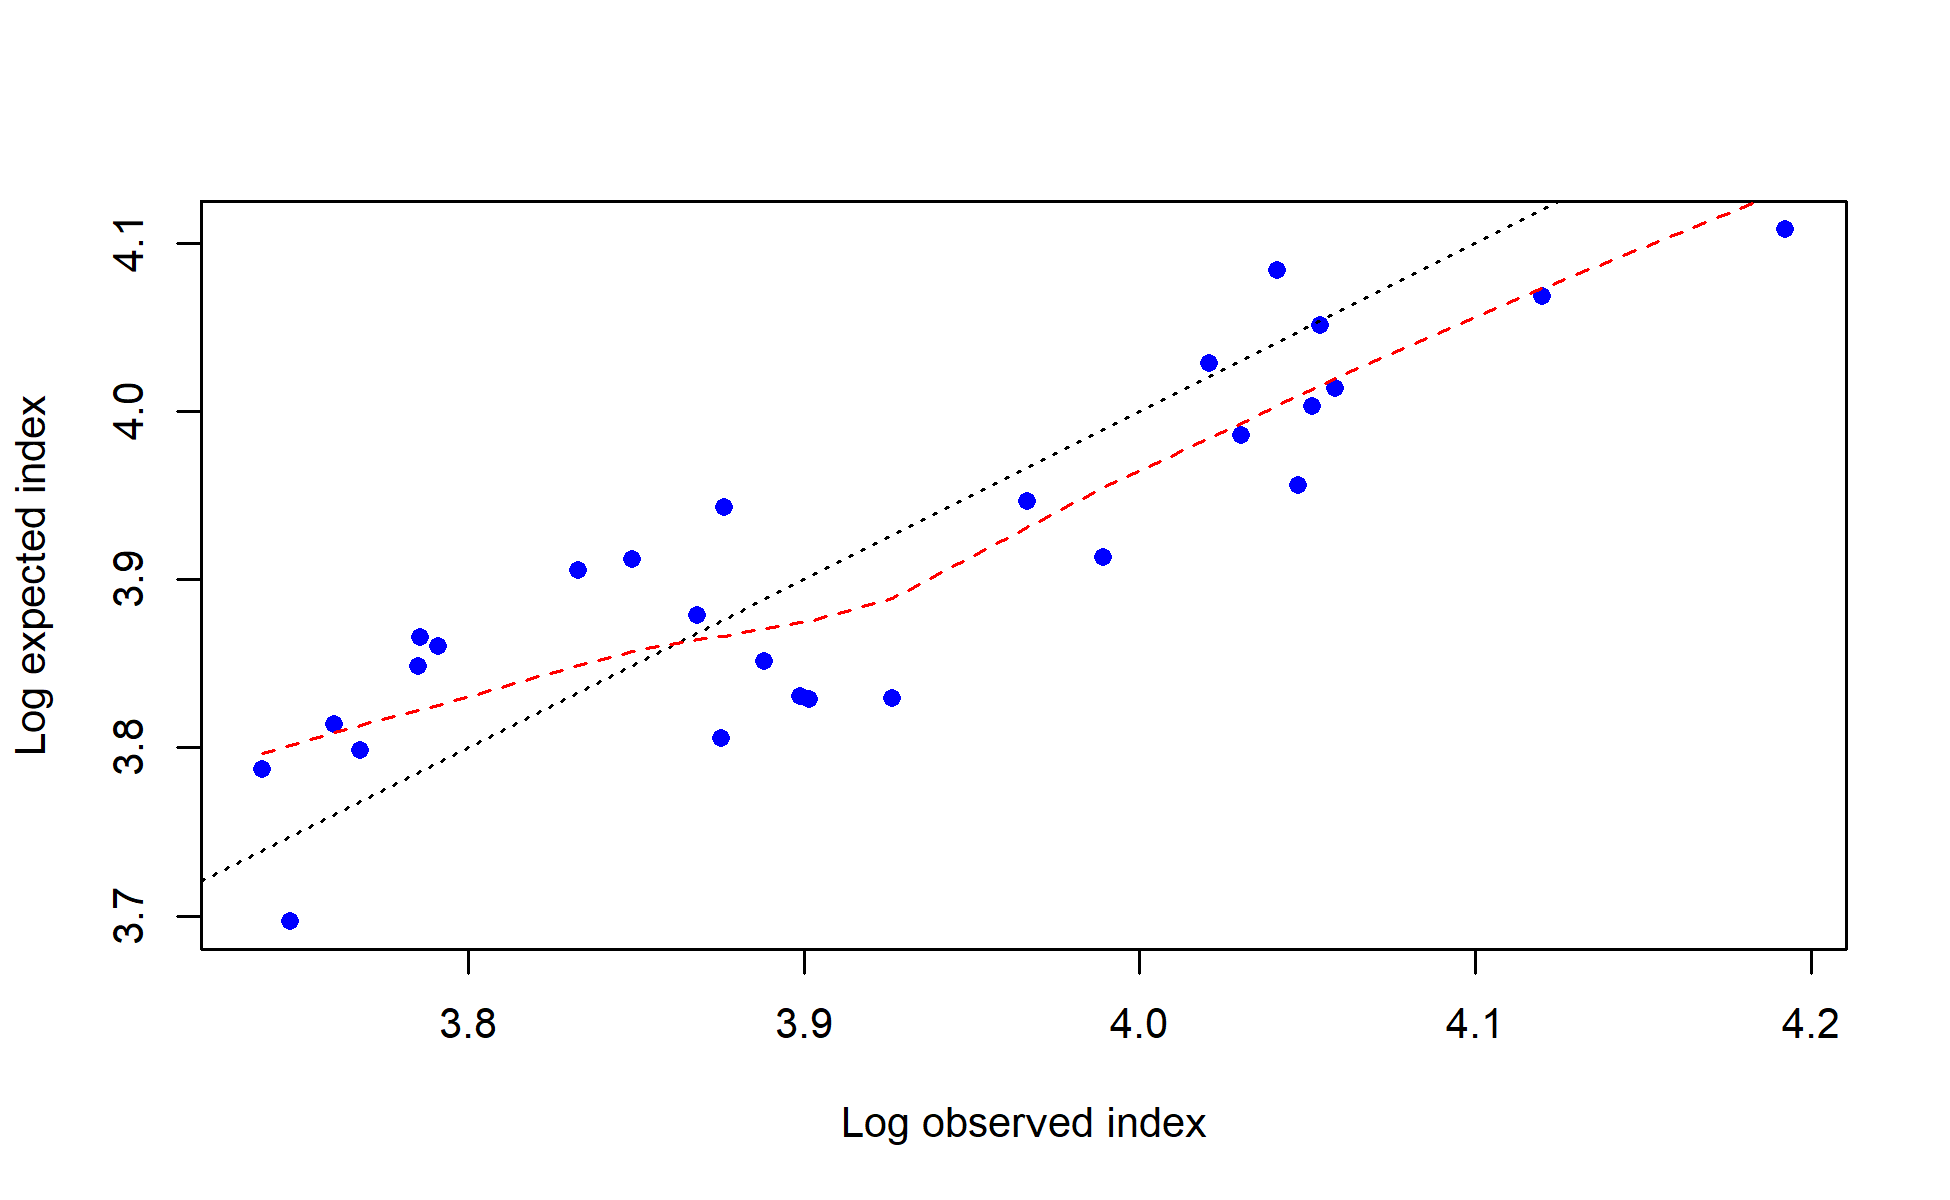
log(observed) vs. log(expected) index values with smoother for Fishery
file: index6_log_obs_vs_exp_Fishery.png
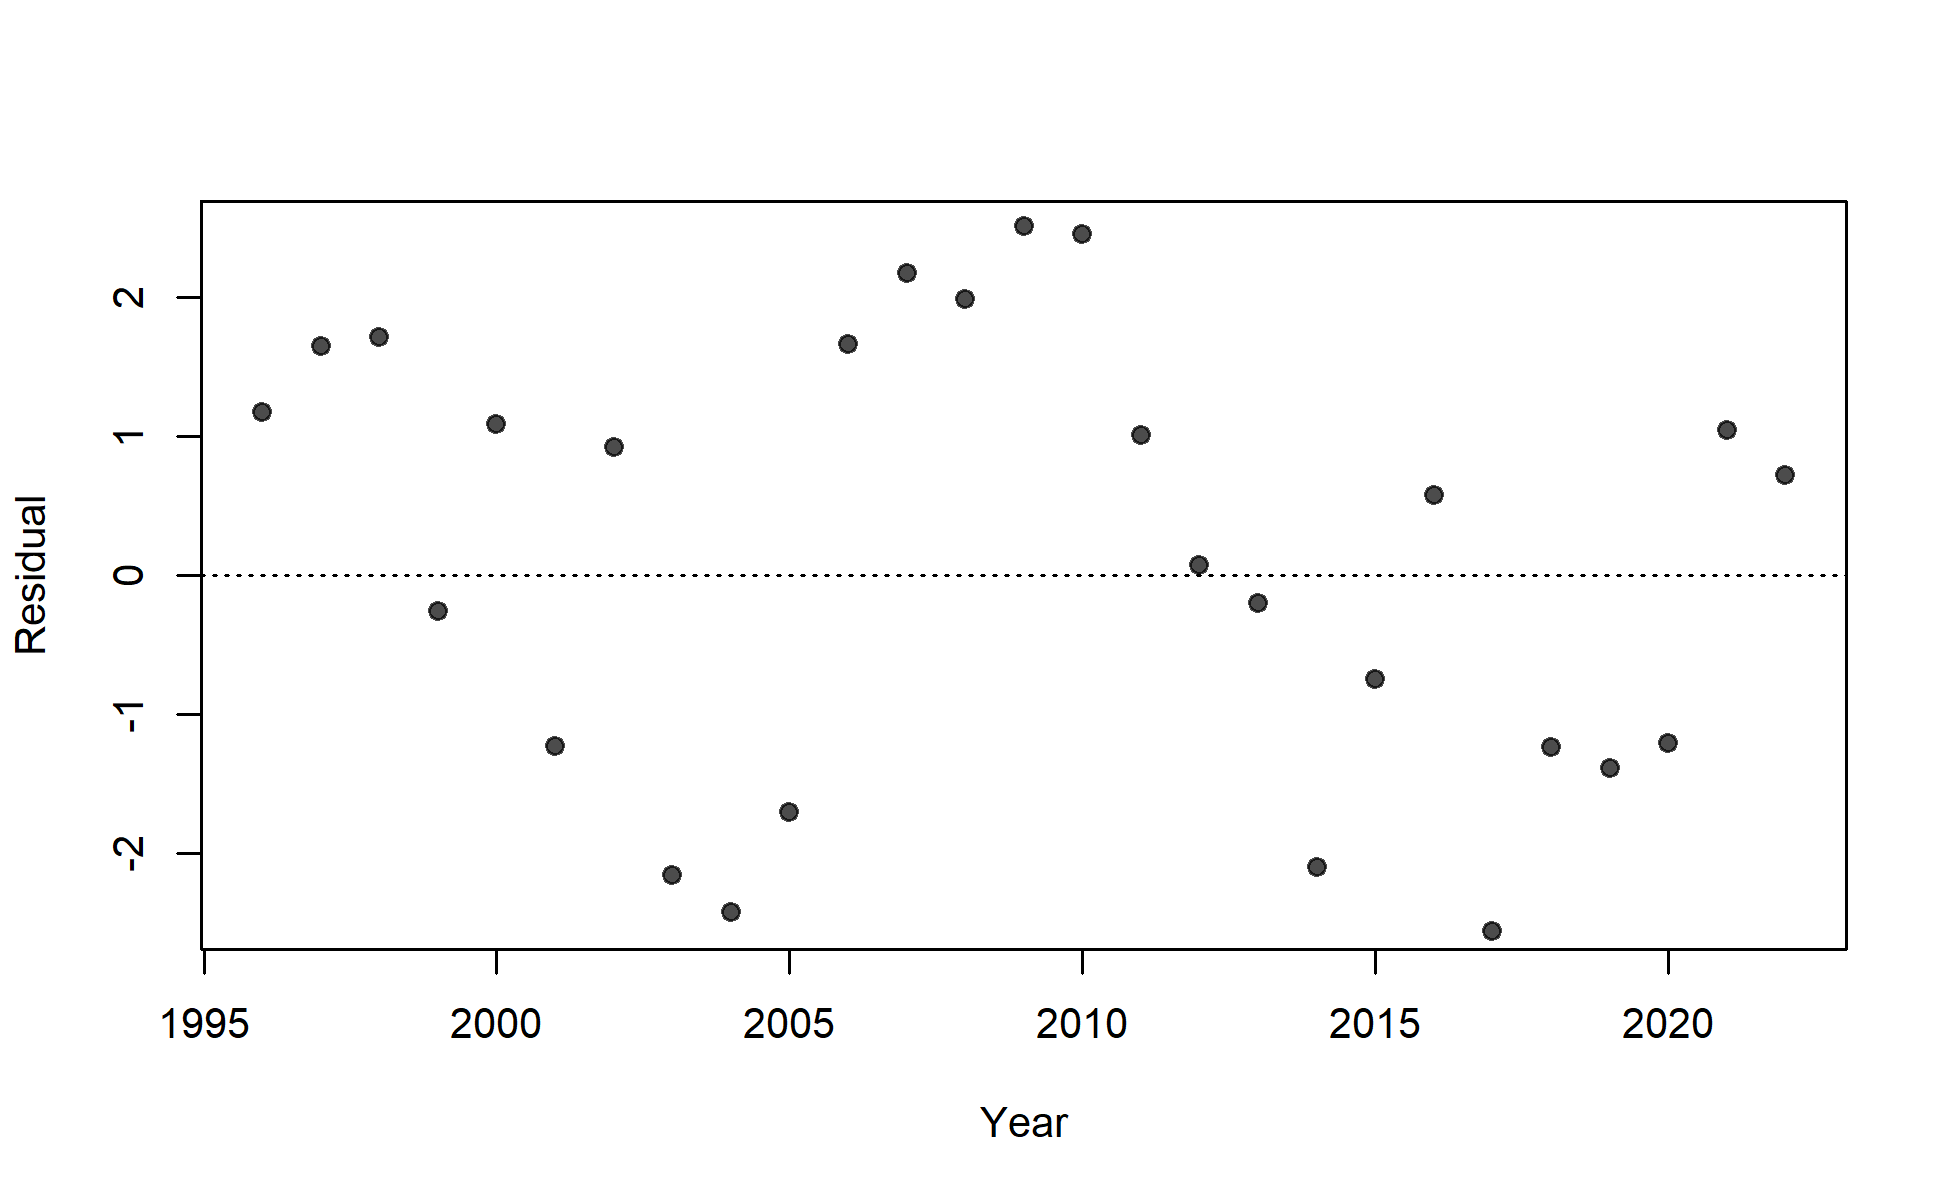
Residuals of fit to index for Fishery.
Values are (log(Obs) - log(Exp))/SE where SE is the total standard error including any estimated additional uncertainty.
file: index10_resids_SE_total_Fishery.png
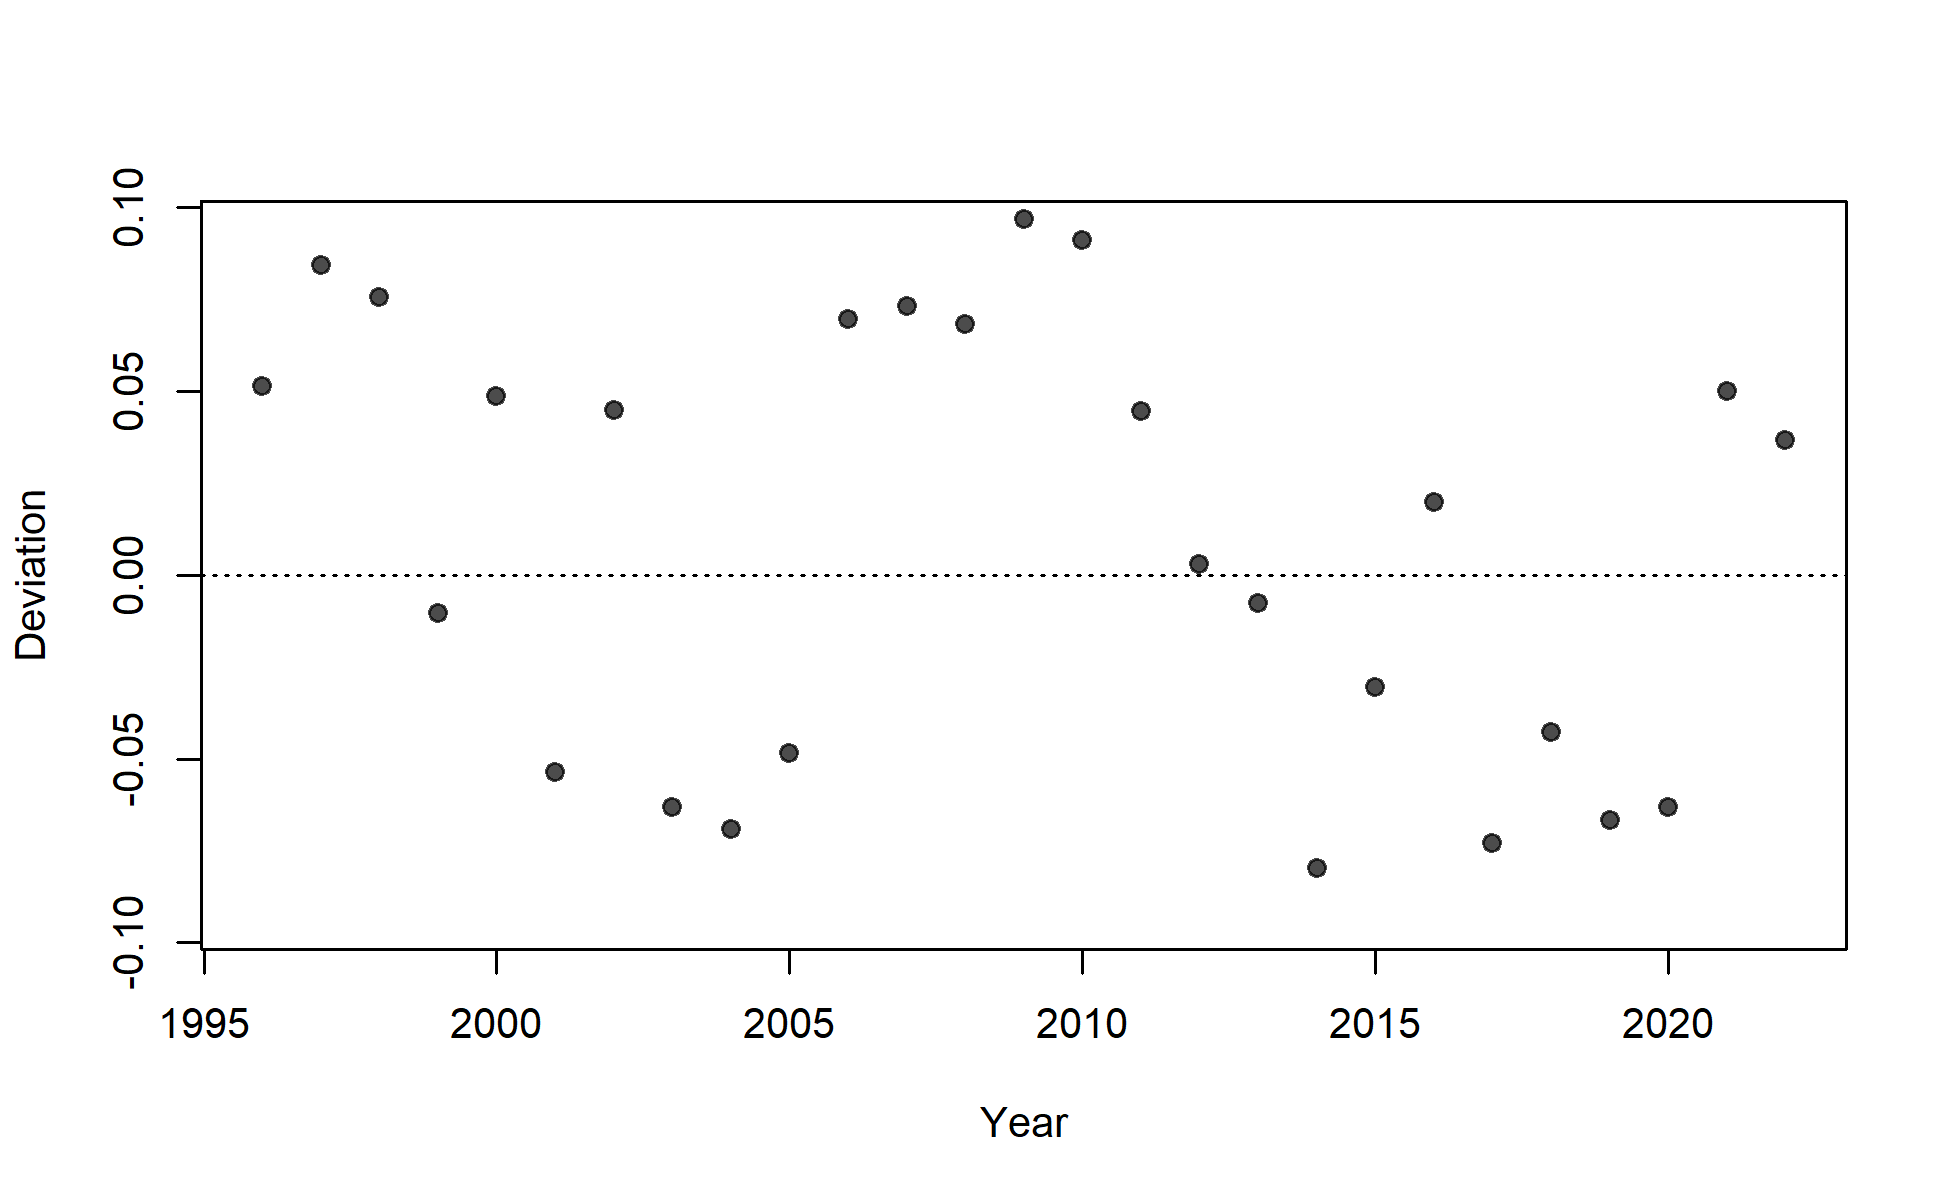
Deviations for fit to index for Fishery.
Values are log(Obs) - log(Exp) and thus independent of index uncertainty.
file: index12_resids_SE_total_Fishery.png
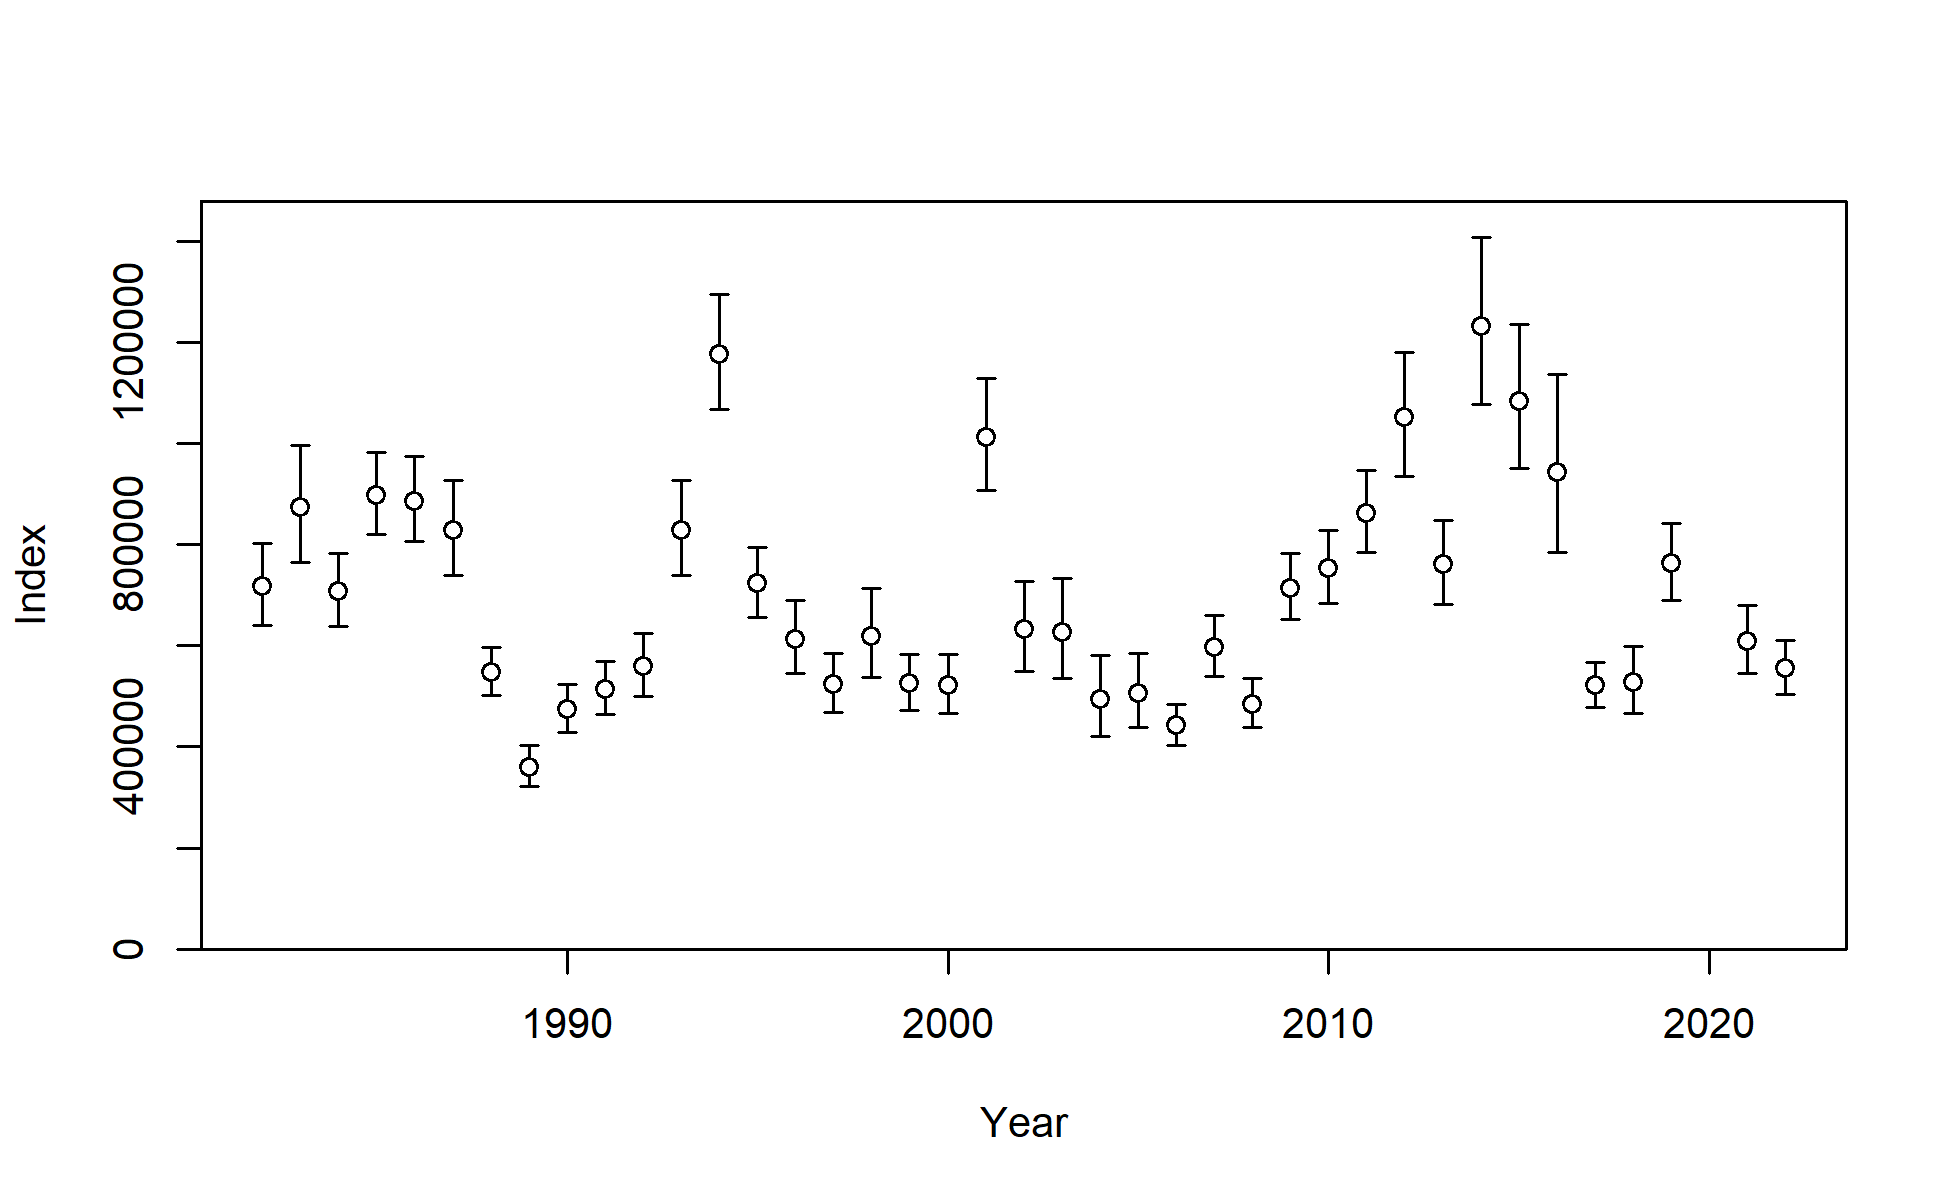
Index data for Survey. Lines indicate 95% uncertainty interval around index values based on the model assumption of lognormal error. Thicker lines (if present) indicate input uncertainty before addition of estimated additional uncertainty parameter.
file: index1_cpuedata_Survey.png
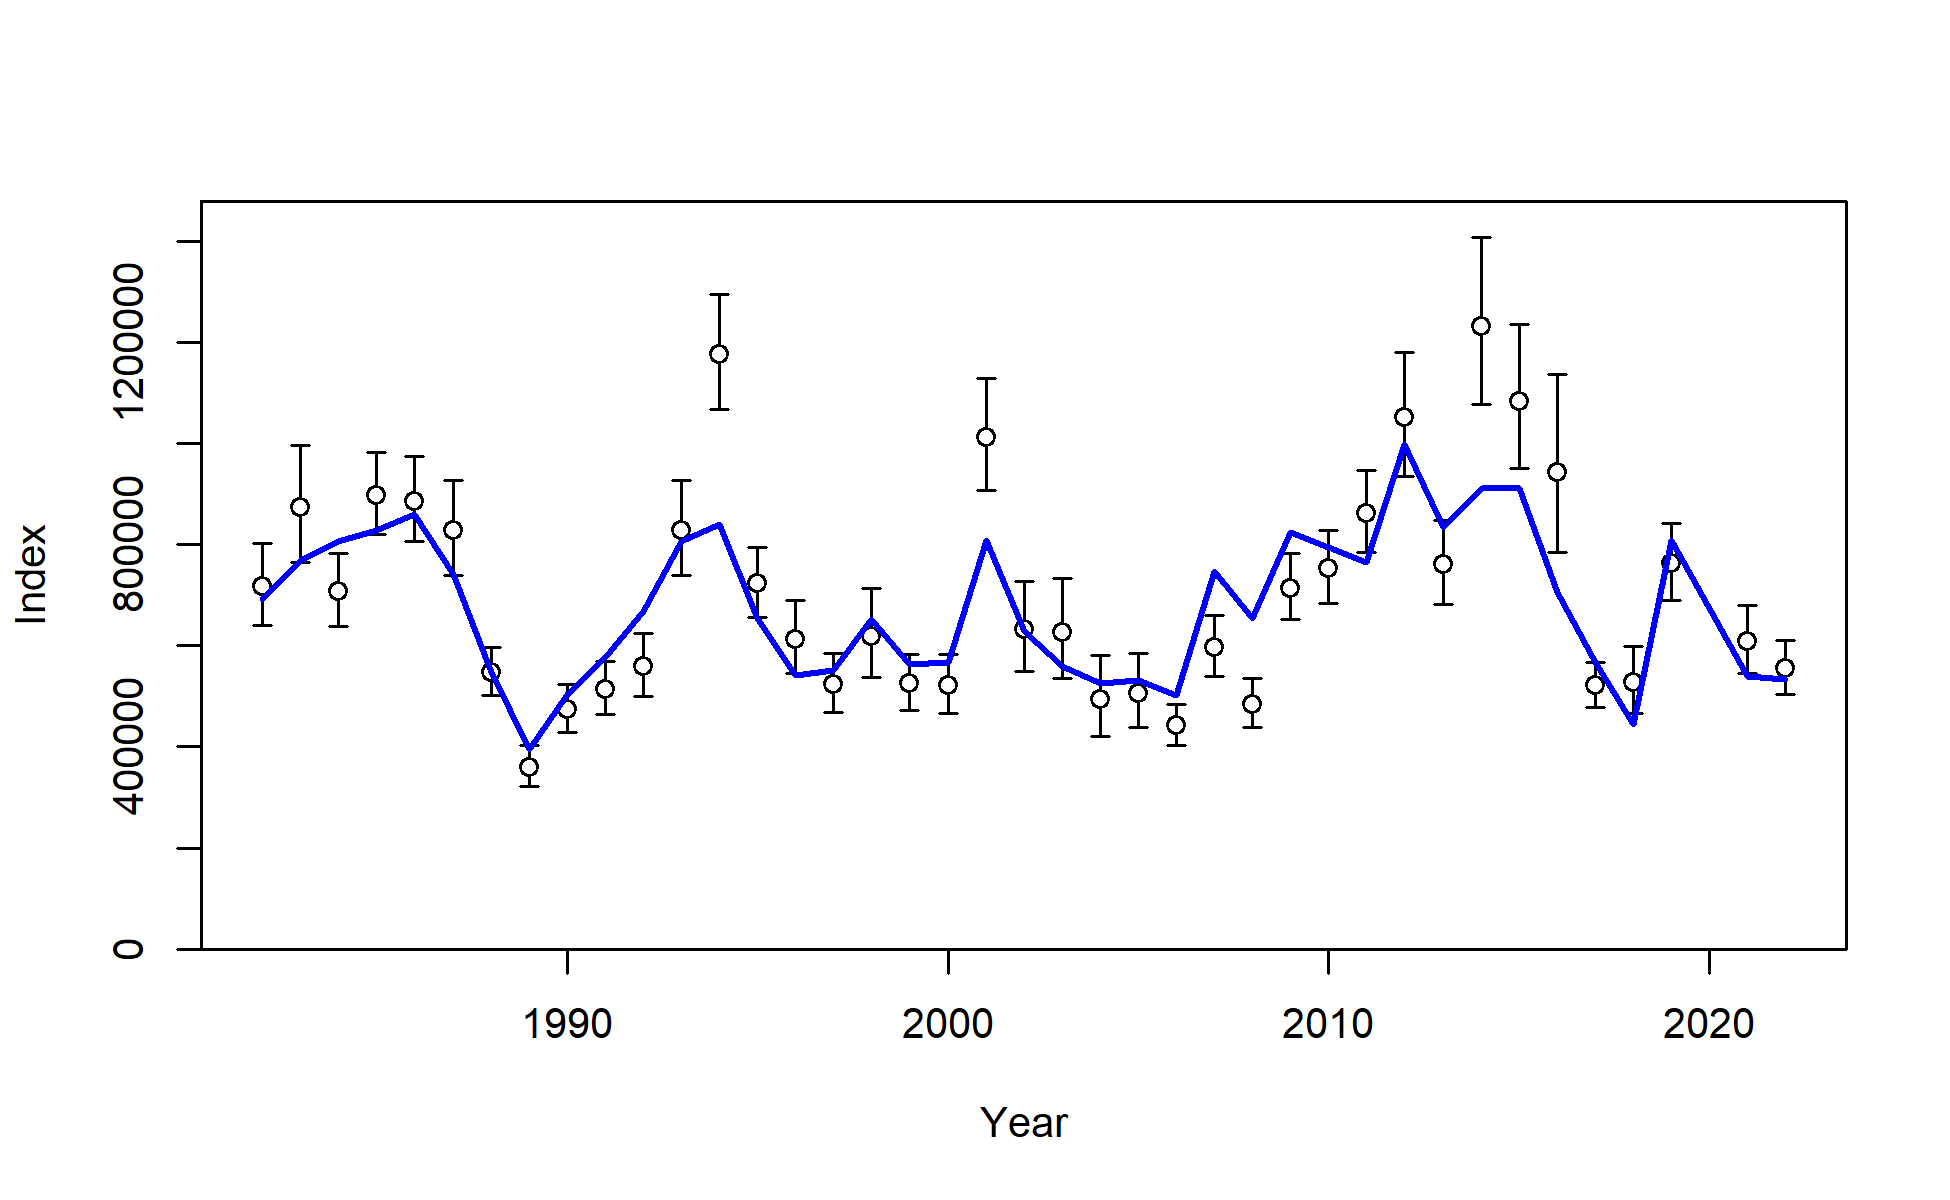
Fit to index data for Survey. Lines indicate 95% uncertainty interval around index values based on the model assumption of lognormal error. Thicker lines (if present) indicate input uncertainty before addition of estimated additional uncertainty parameter.
file: index2_cpuefit_Survey.png
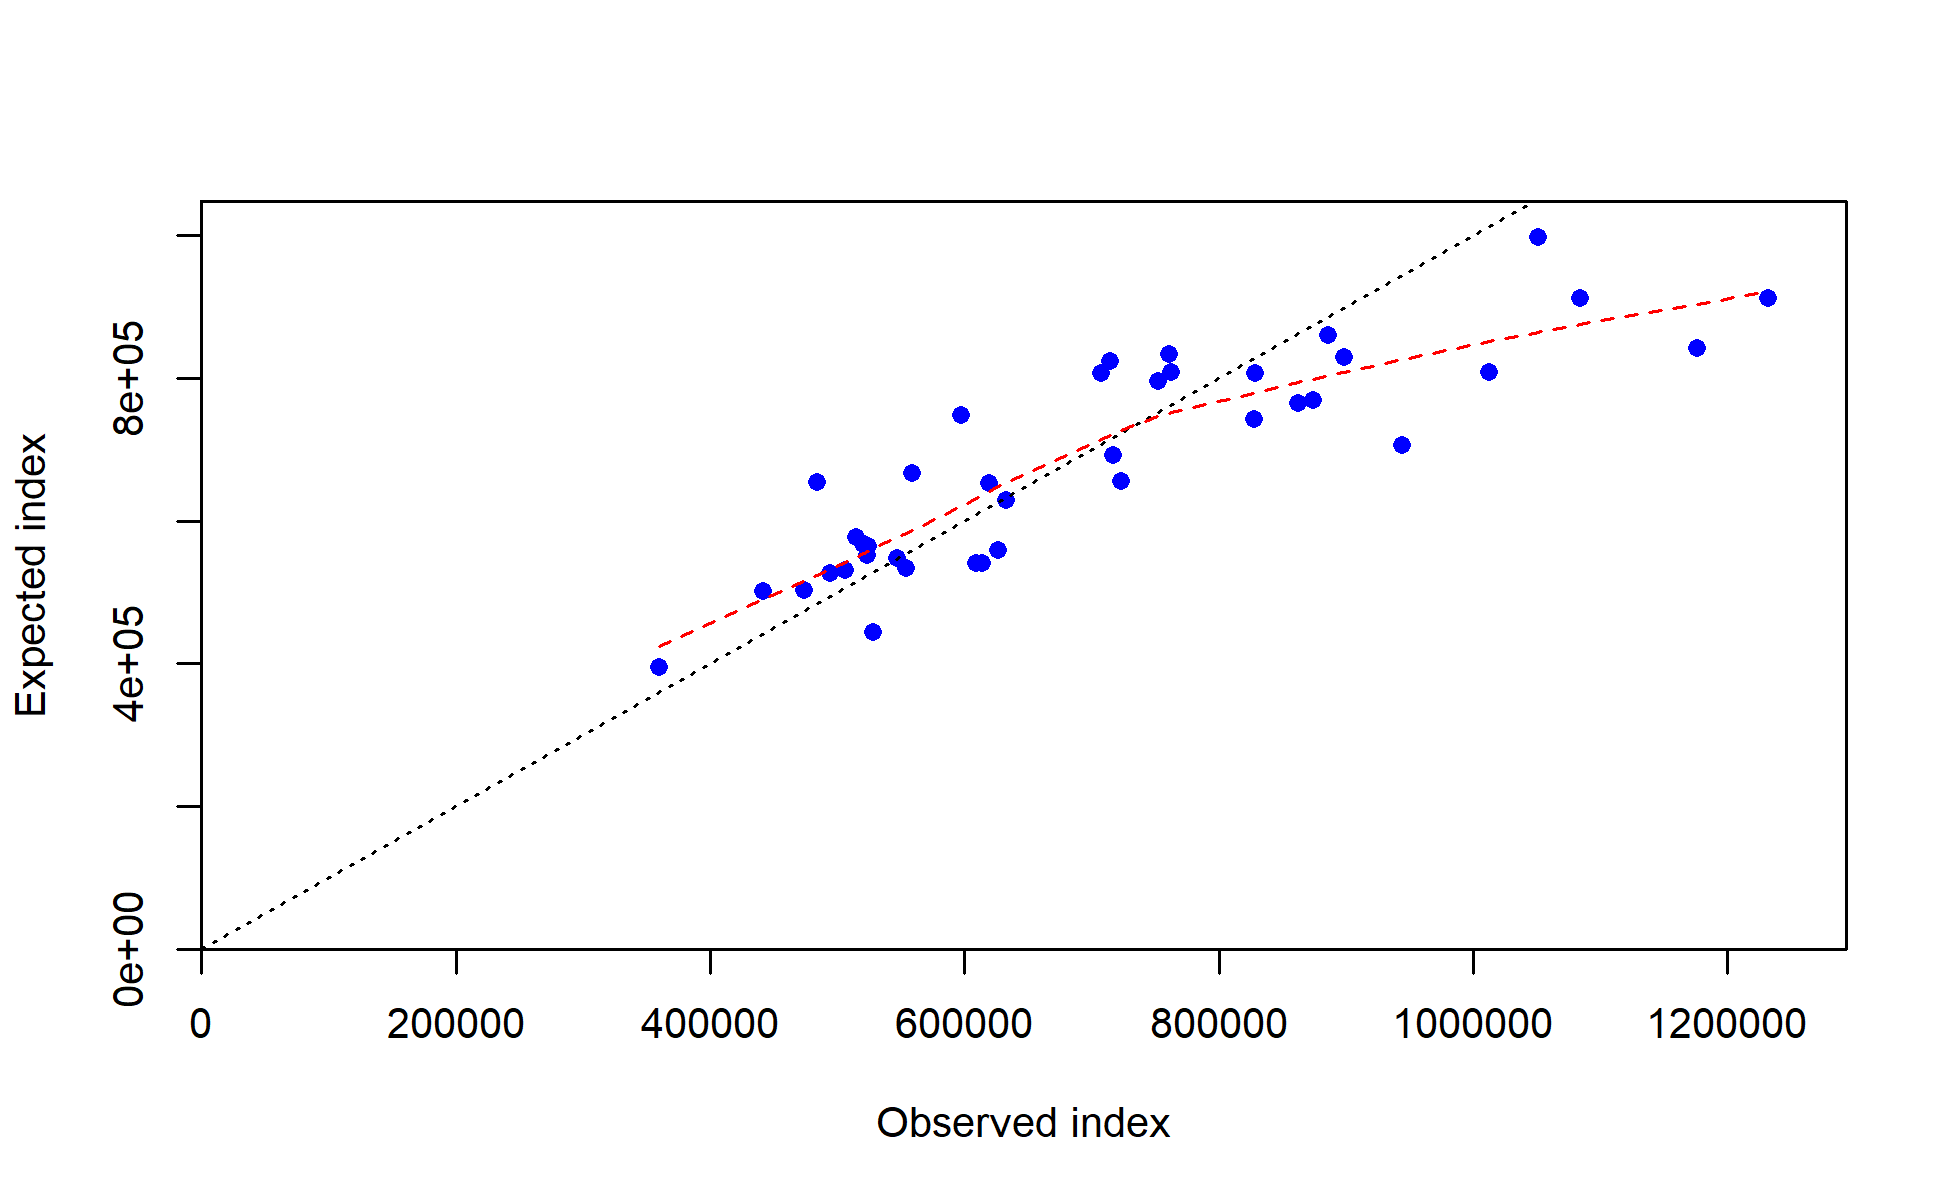
Observed vs. expected index values with smoother for Survey
file: index3_obs_vs_exp_Survey.png
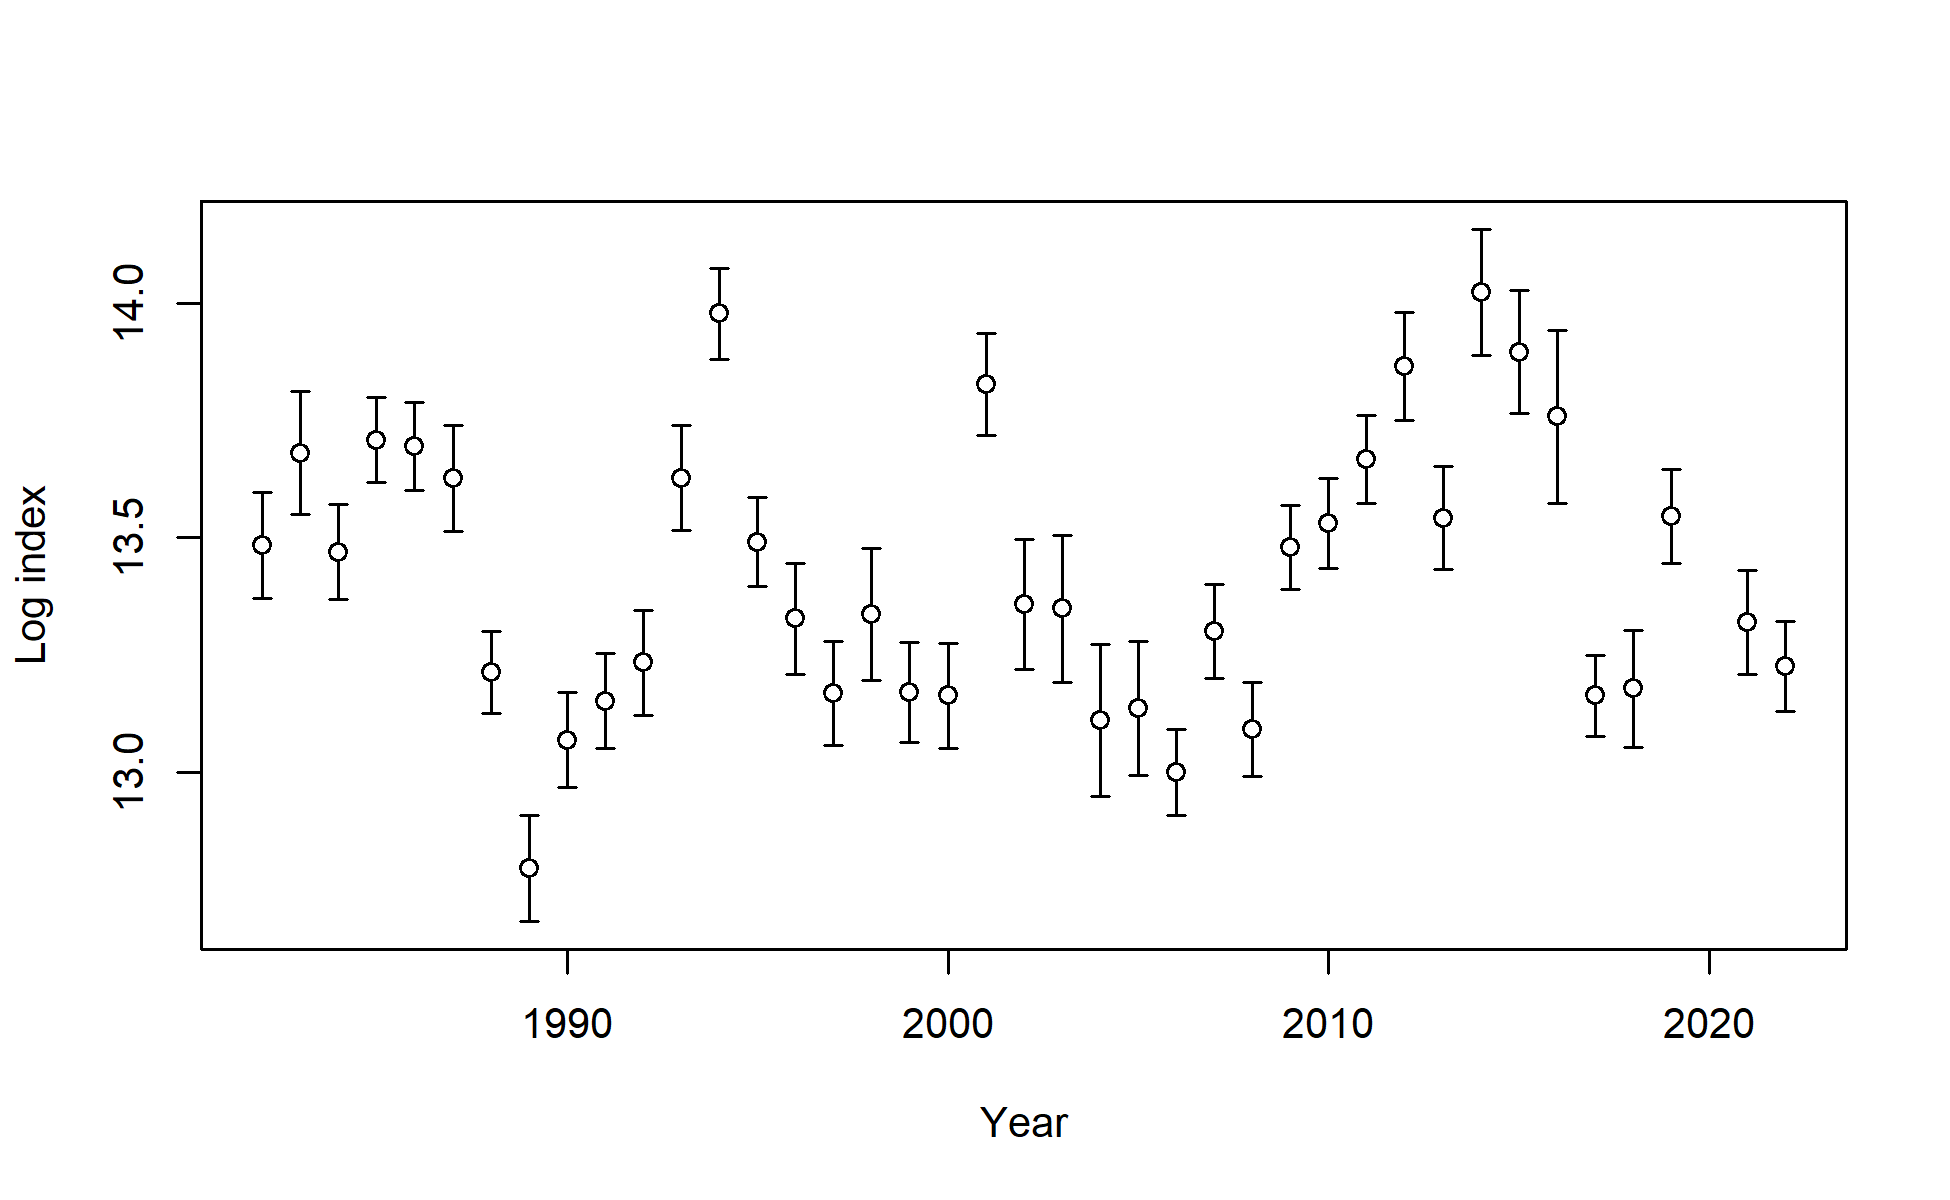
Log index data for Survey. Lines indicate 95% uncertainty interval around index values based on the model assumption of lognormal error. Thicker lines (if present) indicate input uncertainty before addition of estimated additional uncertainty parameter.
file: index4_logcpuedata_Survey.png
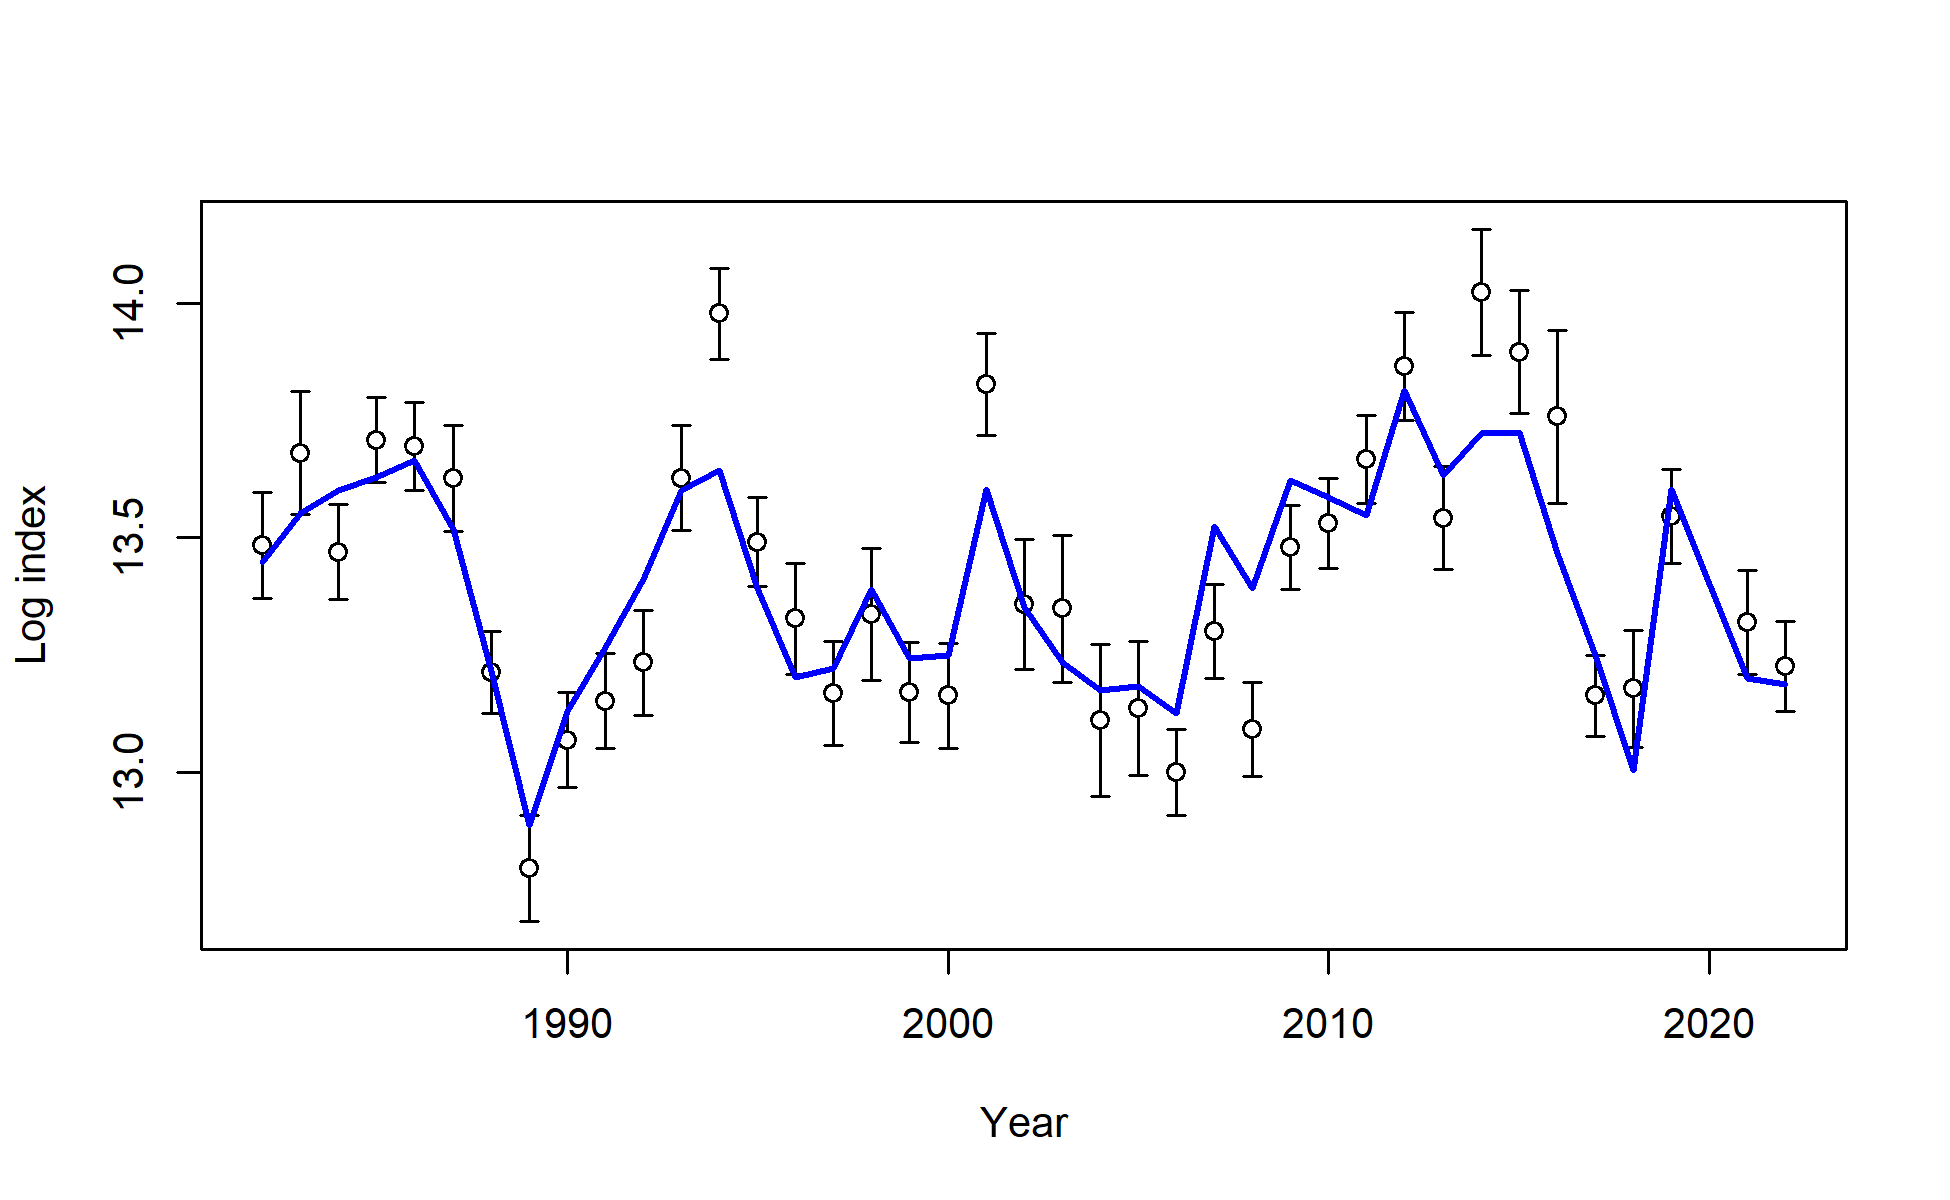
Fit to log index data on log scale for Survey. Lines indicate 95% uncertainty interval around index values based on the model assumption of lognormal error. Thicker lines (if present) indicate input uncertainty before addition of estimated additional uncertainty parameter.
file: index5_logcpuefit_Survey.png
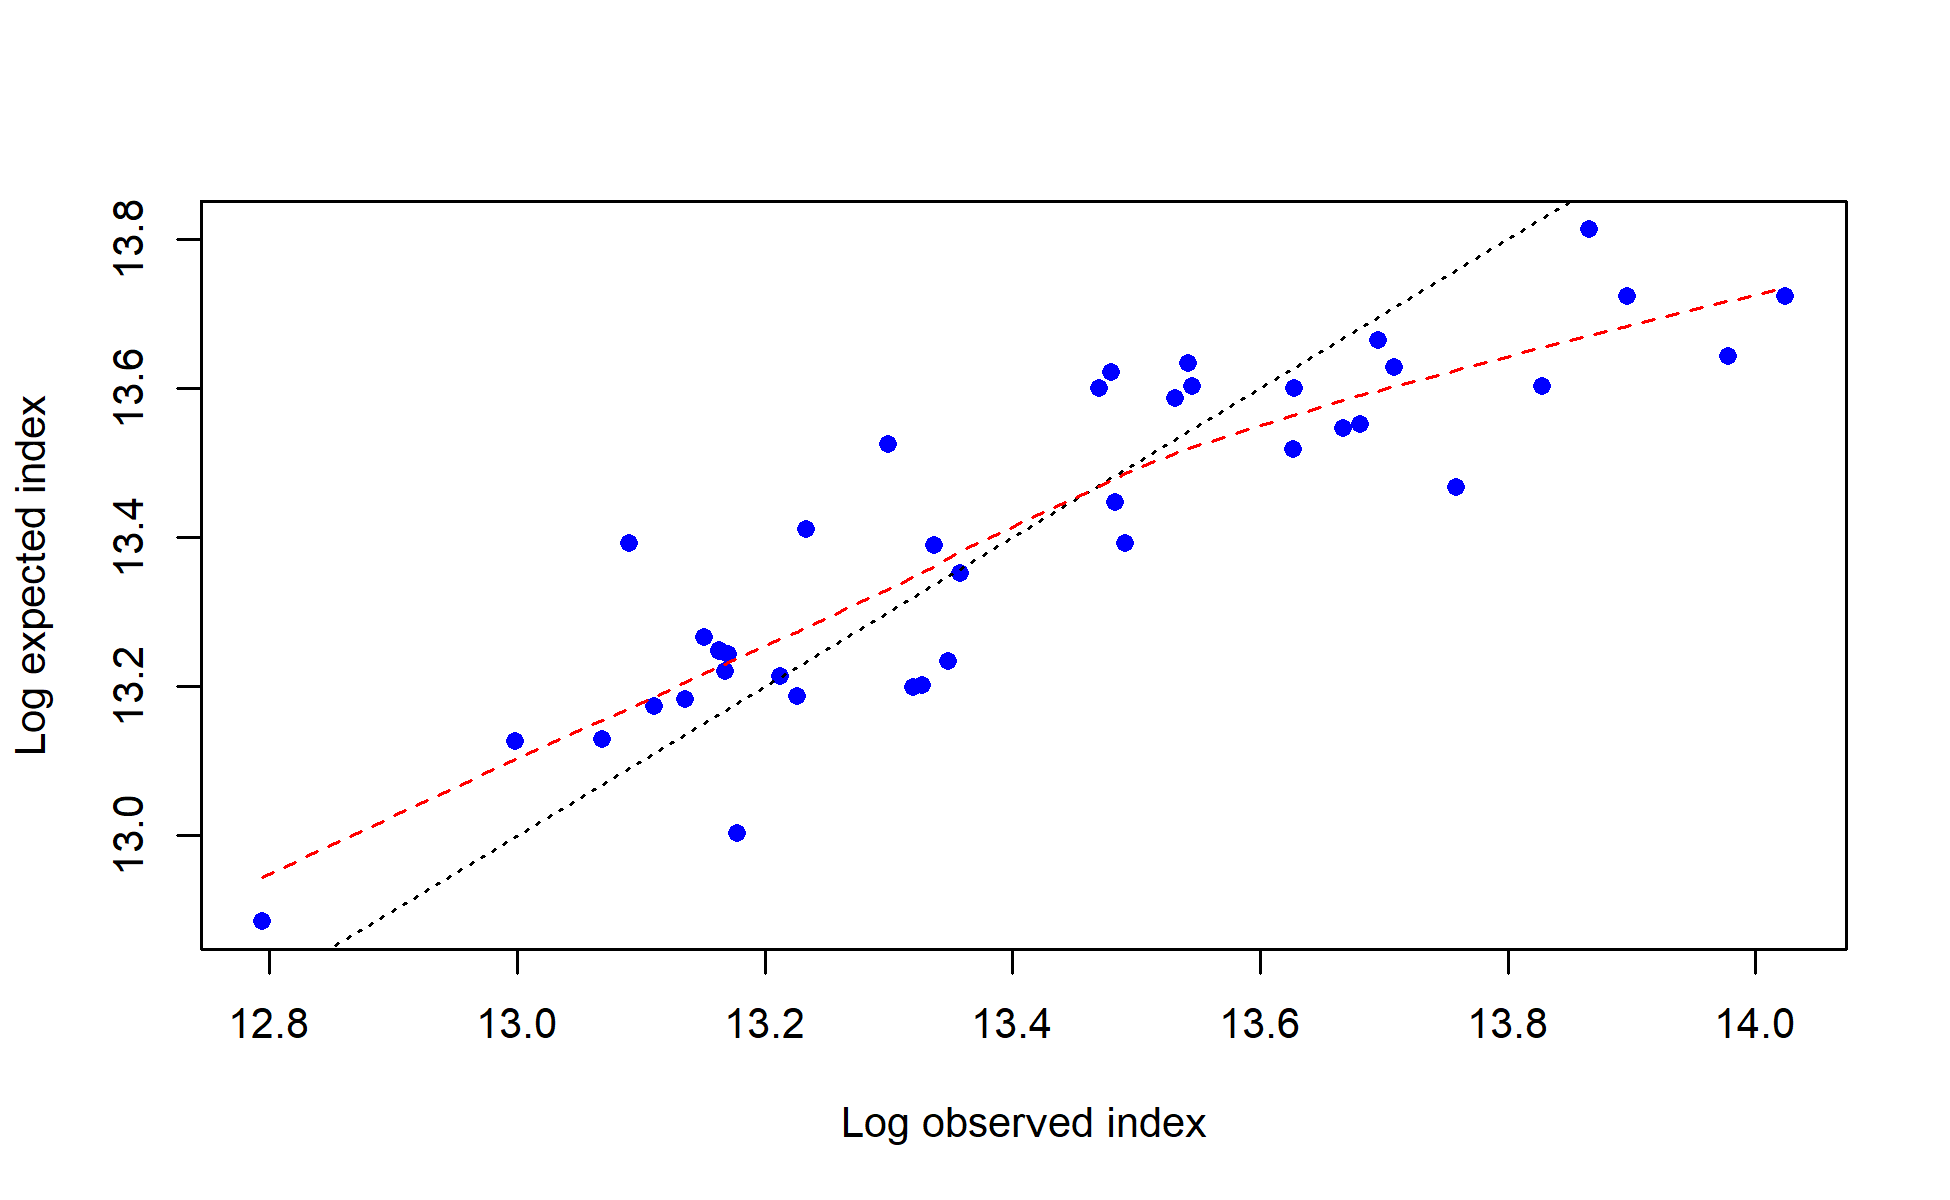
log(observed) vs. log(expected) index values with smoother for Survey
file: index6_log_obs_vs_exp_Survey.png
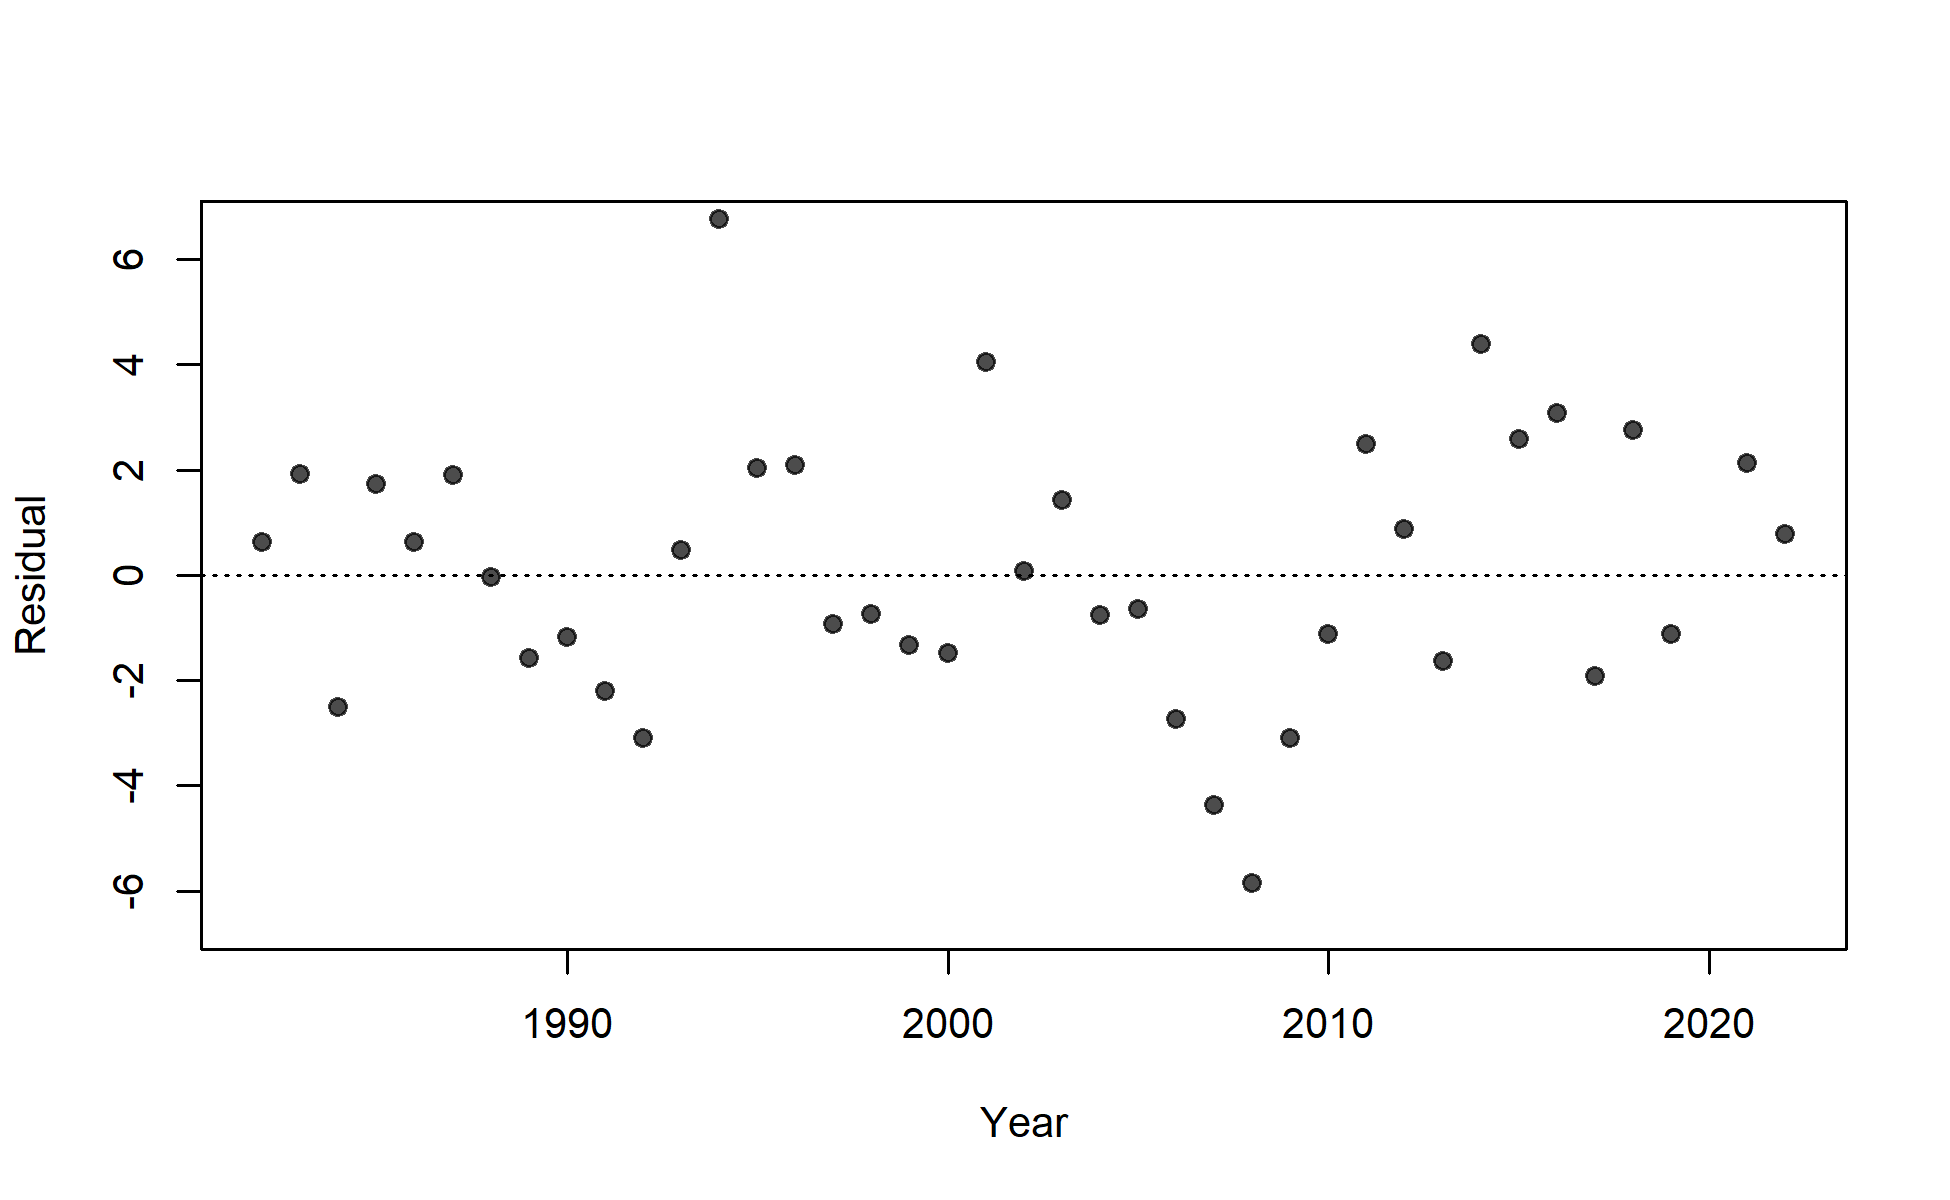
Residuals of fit to index for Survey.
Values are (log(Obs) - log(Exp))/SE where SE is the total standard error including any estimated additional uncertainty.
file: index10_resids_SE_total_Survey.png
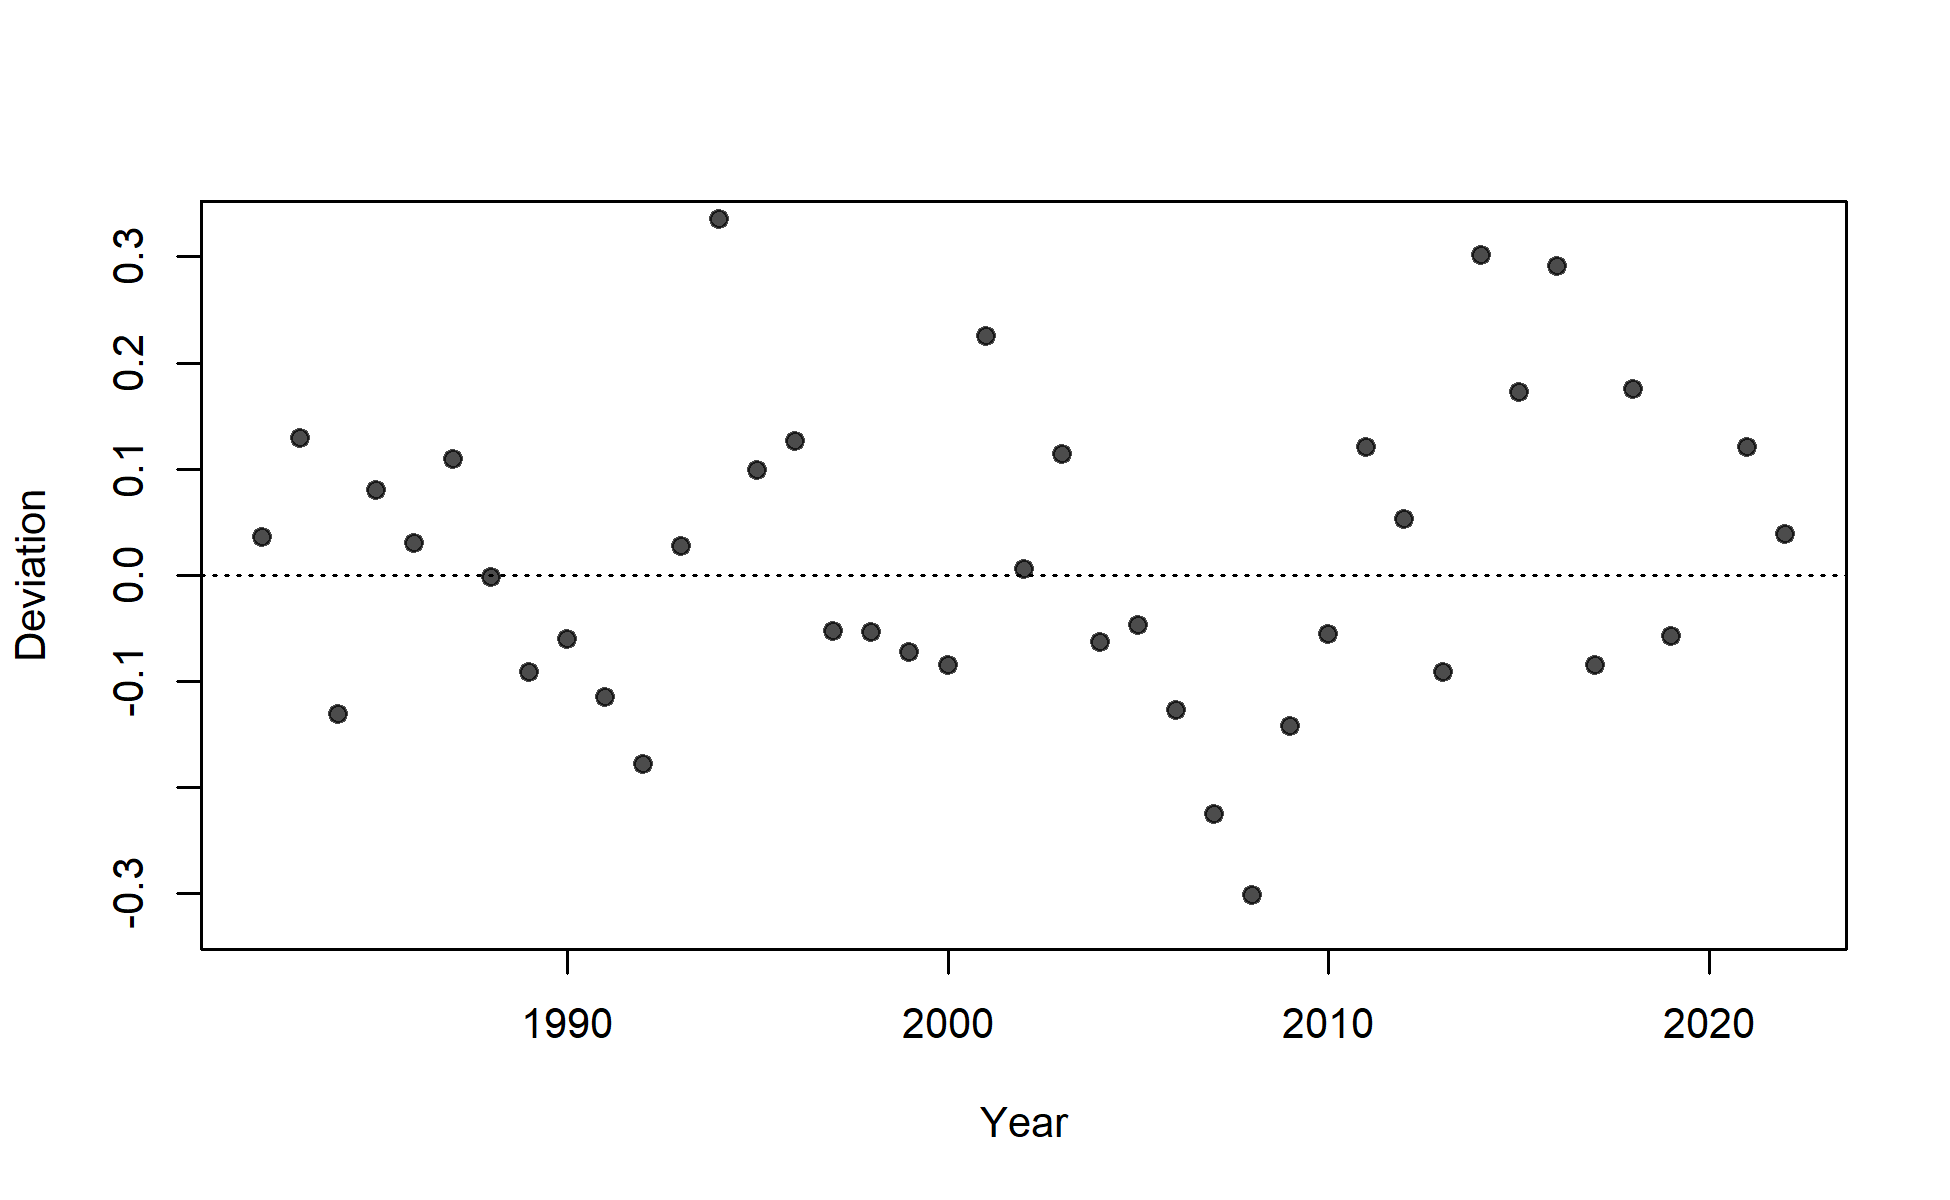
Deviations for fit to index for Survey.
Values are log(Obs) - log(Exp) and thus independent of index uncertainty.
file: index12_resids_SE_total_Survey.png
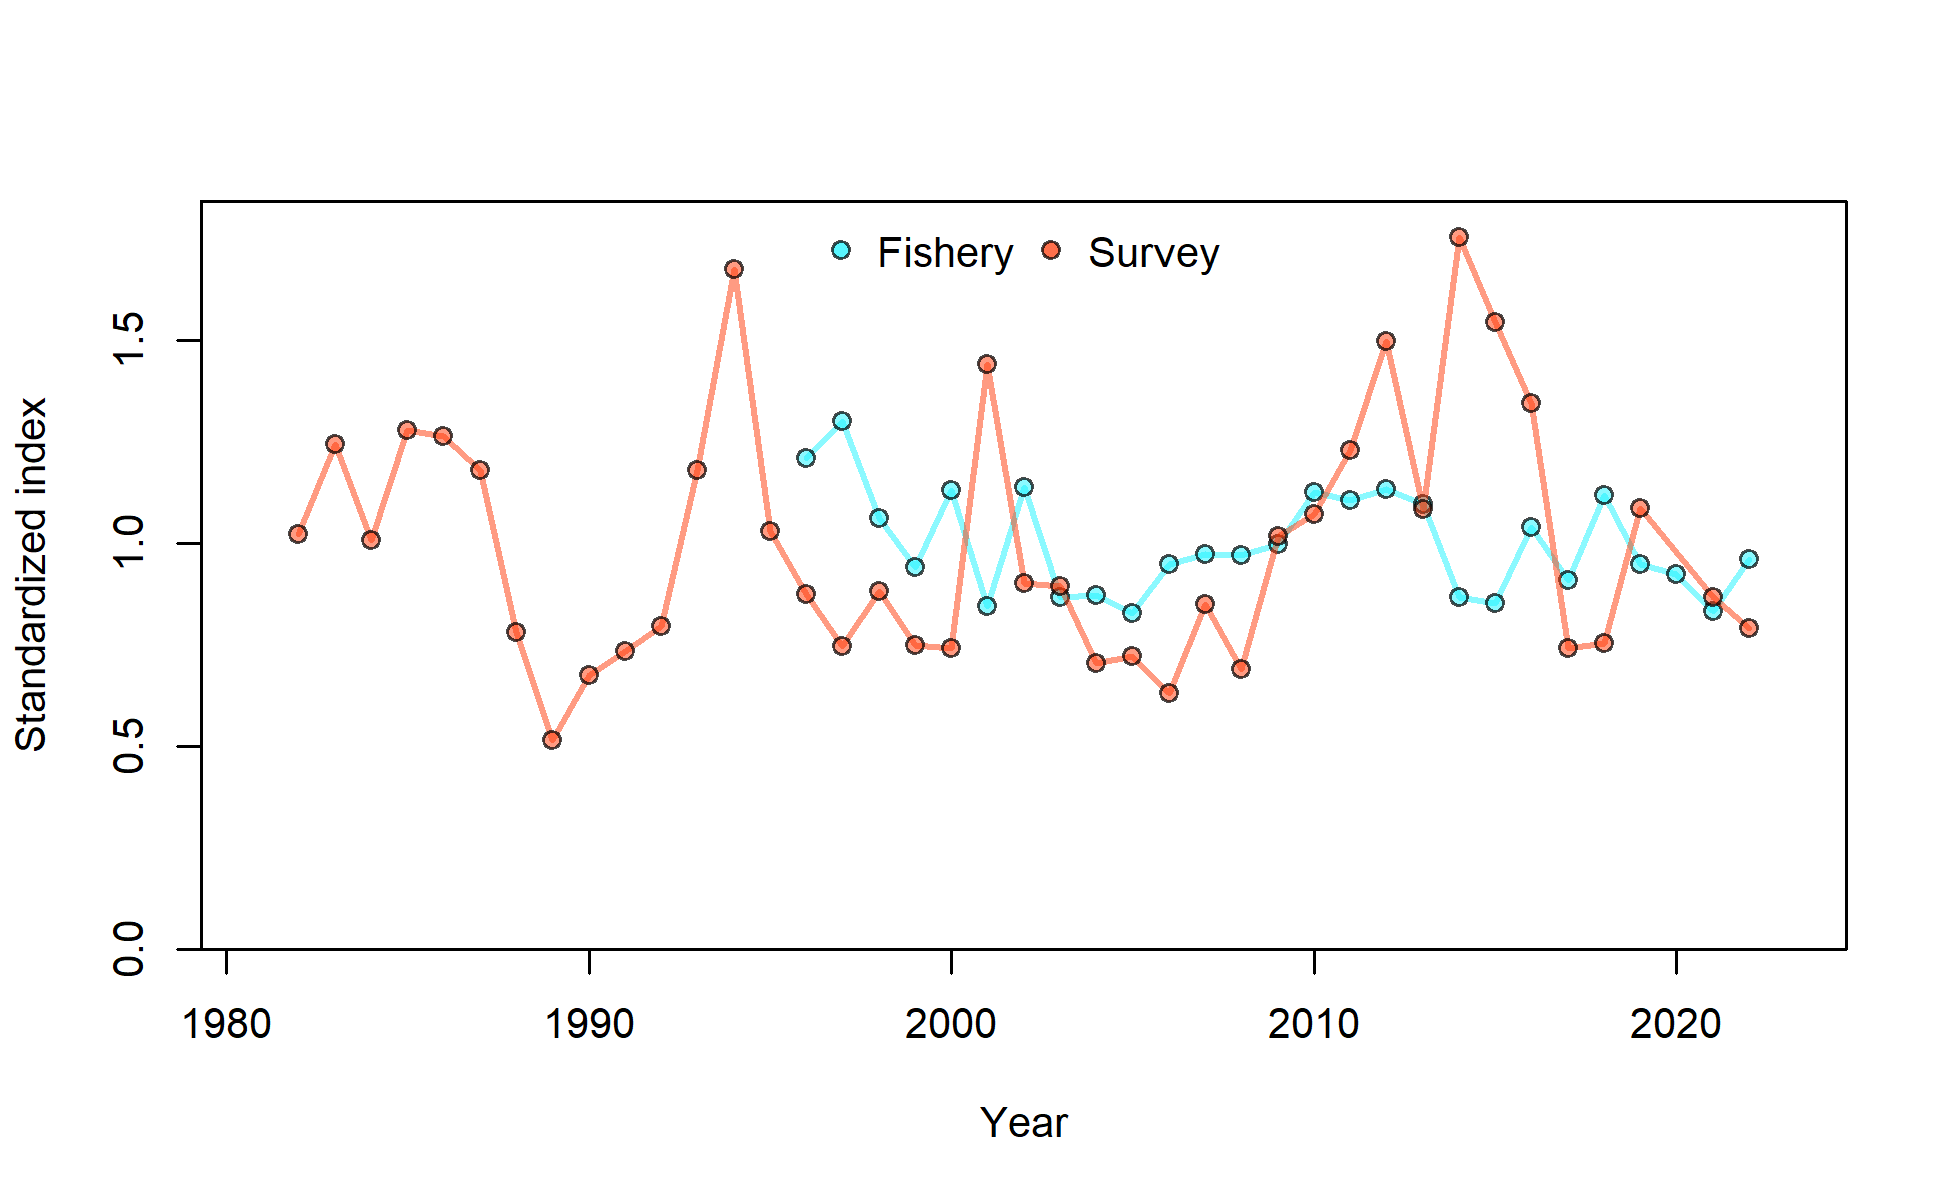
Standardized indices overlaid. Each index is rescaled to have mean observation = 1.0.
file: index9_standcpueall.png